Overview: Get familiar with the Runs tab
Overview: Get familiar with the Runs tab
How to: Sort and filter run histories
How to: Sort and filter run histories
- The default view on the Runs tab displays past runs, sorted by date in descending order.
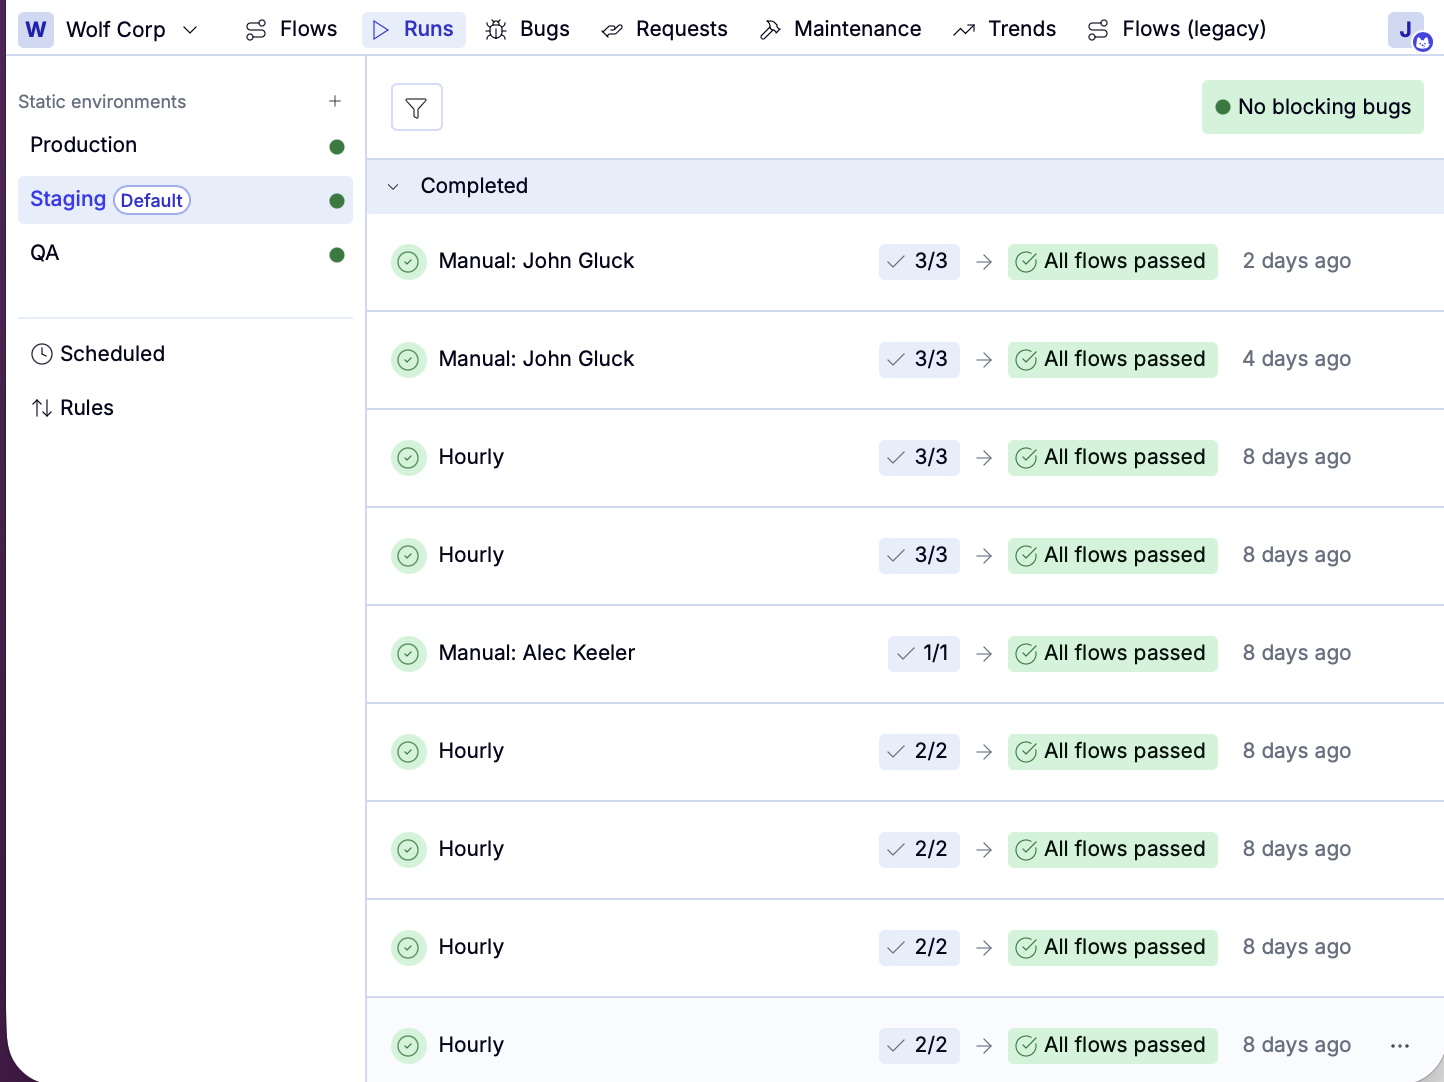
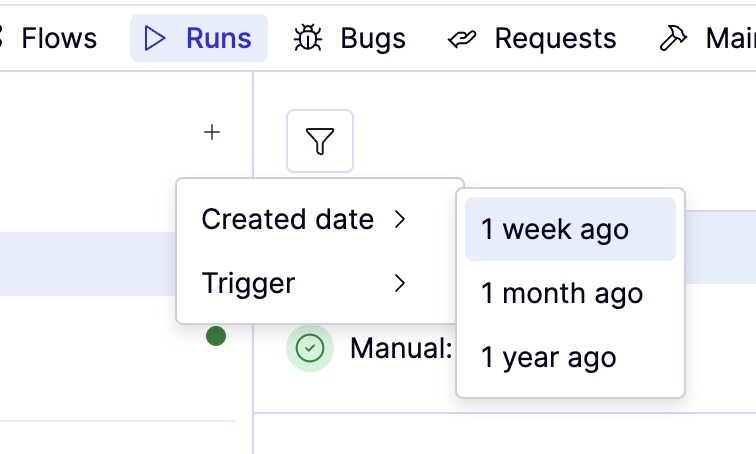
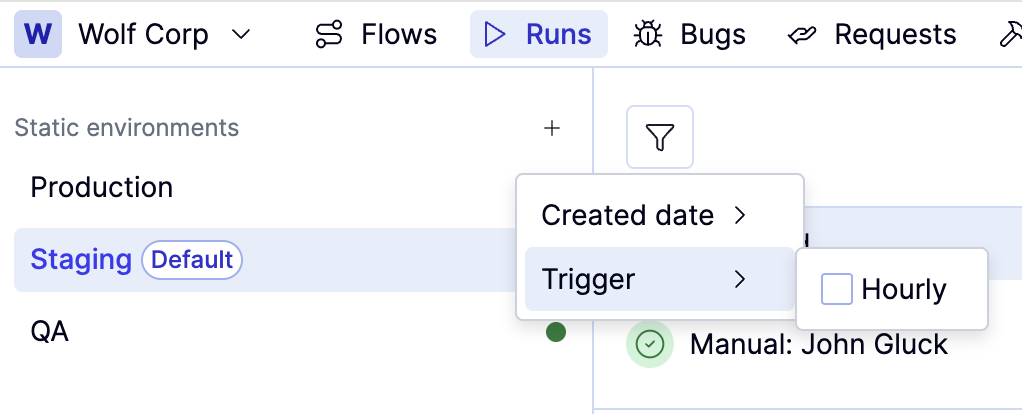
- You can filter the list by clicking the icon.
- Created date lets you filter runs by 1 week ago, 1 month ago, or 1 year ago.
- Trigger lets you filter runs by schedule frequency: Hourly or Weekly.
How to: Identify failed runs that need attention
How to: Identify failed runs that need attention
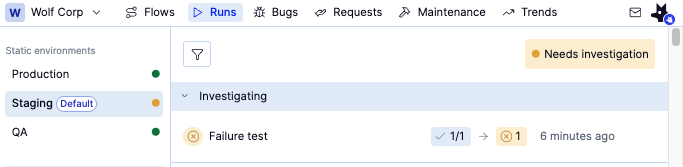
Go to the Runs tab. The icon next to the environment name indicates the status of flows from previous runs.
| Environment status | Meaning |
|---|---|
| Red – Failed | High severity bug reported |
| Yellow – Needs investigation | Failed flow or Medium or low priority bug reported |
| Green – Ready | All flows passing |
Select the environment you are investigating. Runs are sorted into three categories: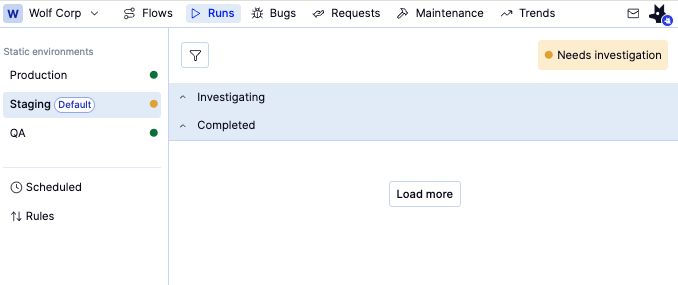
- Completed: All flows in the run have passed or been marked Do Not Investigate.
- Investigating: Flows in the run failed, but have not been marked Do Not Investigate.
- Canceled. The run was cancelled mid-execution by a subsequent run matching the same branch and environment.