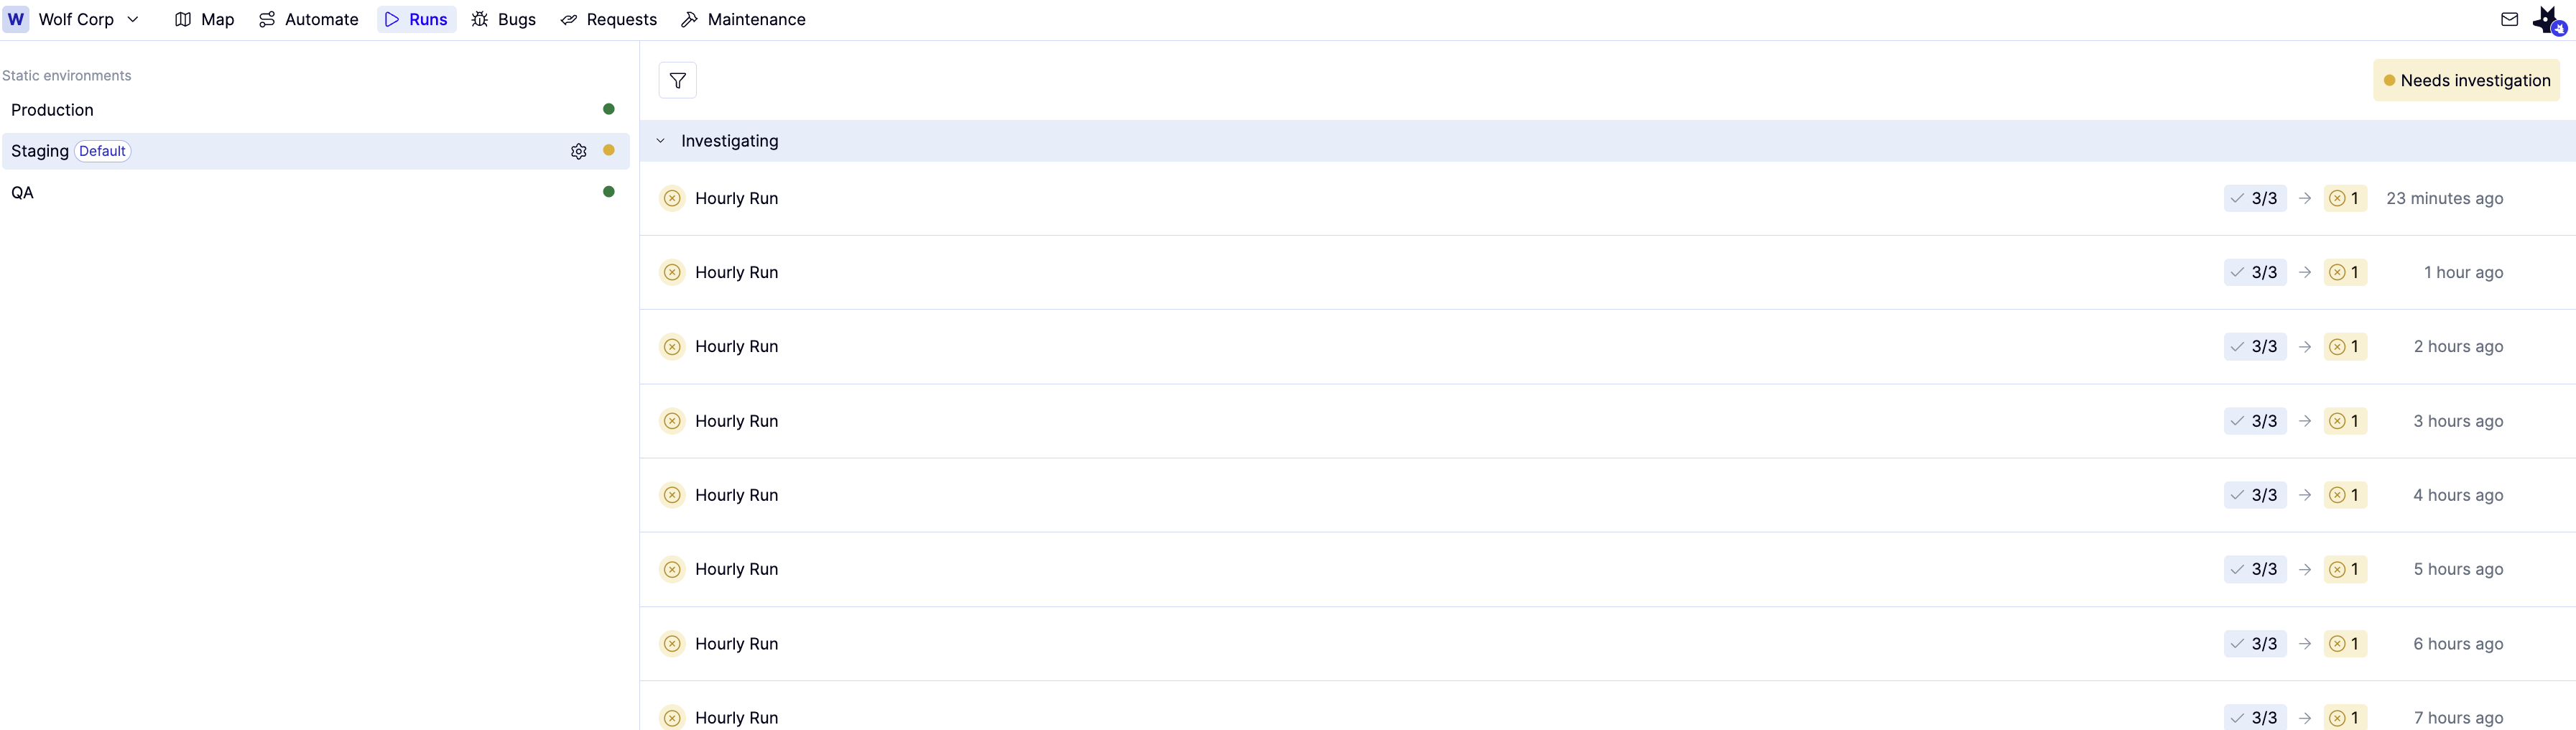
Overview
For each run, the list shows:- The name of the schedule that triggered the run
- — the number of fully passing attempts over total attempts
- — the number of flows still requiring investigation
- — the number of open bug reports linked to flows in the run
- — the number of open maintenance reports linked to flows in the run
- Total wall clock time of the run, including all attempts
Identify environments that need attention
The icon next to each environment name indicates its current status.
You can see environment status in two places:
- On the Runs tab, next to each environment name in the list on the left
- On the Map tab, in the environment name dropdown
Review a run
1
From the Runs tab, select the environment you want to investigate.
2
Runs are grouped into three categories:
- Investigating — flows in the run failed and have not been marked Do Not Investigate
- Completed — all flows have passed or been marked Do Not Investigate
- Canceled — the run was canceled mid-execution by a subsequent run matching the same branch and environment
3
Click the run you want to investigate.
Sort and filter runs
The default view shows past runs sorted by date in descending order. Click the icon to filter by:- Created date — 1 week ago, 1 month ago, or 1 year ago
- Trigger — Hourly or Daily