> ## Documentation Index
> Fetch the complete documentation index at: https://docs.qawolf.com/llms.txt
> Use this file to discover all available pages before exploring further.
# Reviewing run results
> Navigate the Runs tab to review pass rates, failure counts, bug reports, and maintenance status for each run.
## Overview
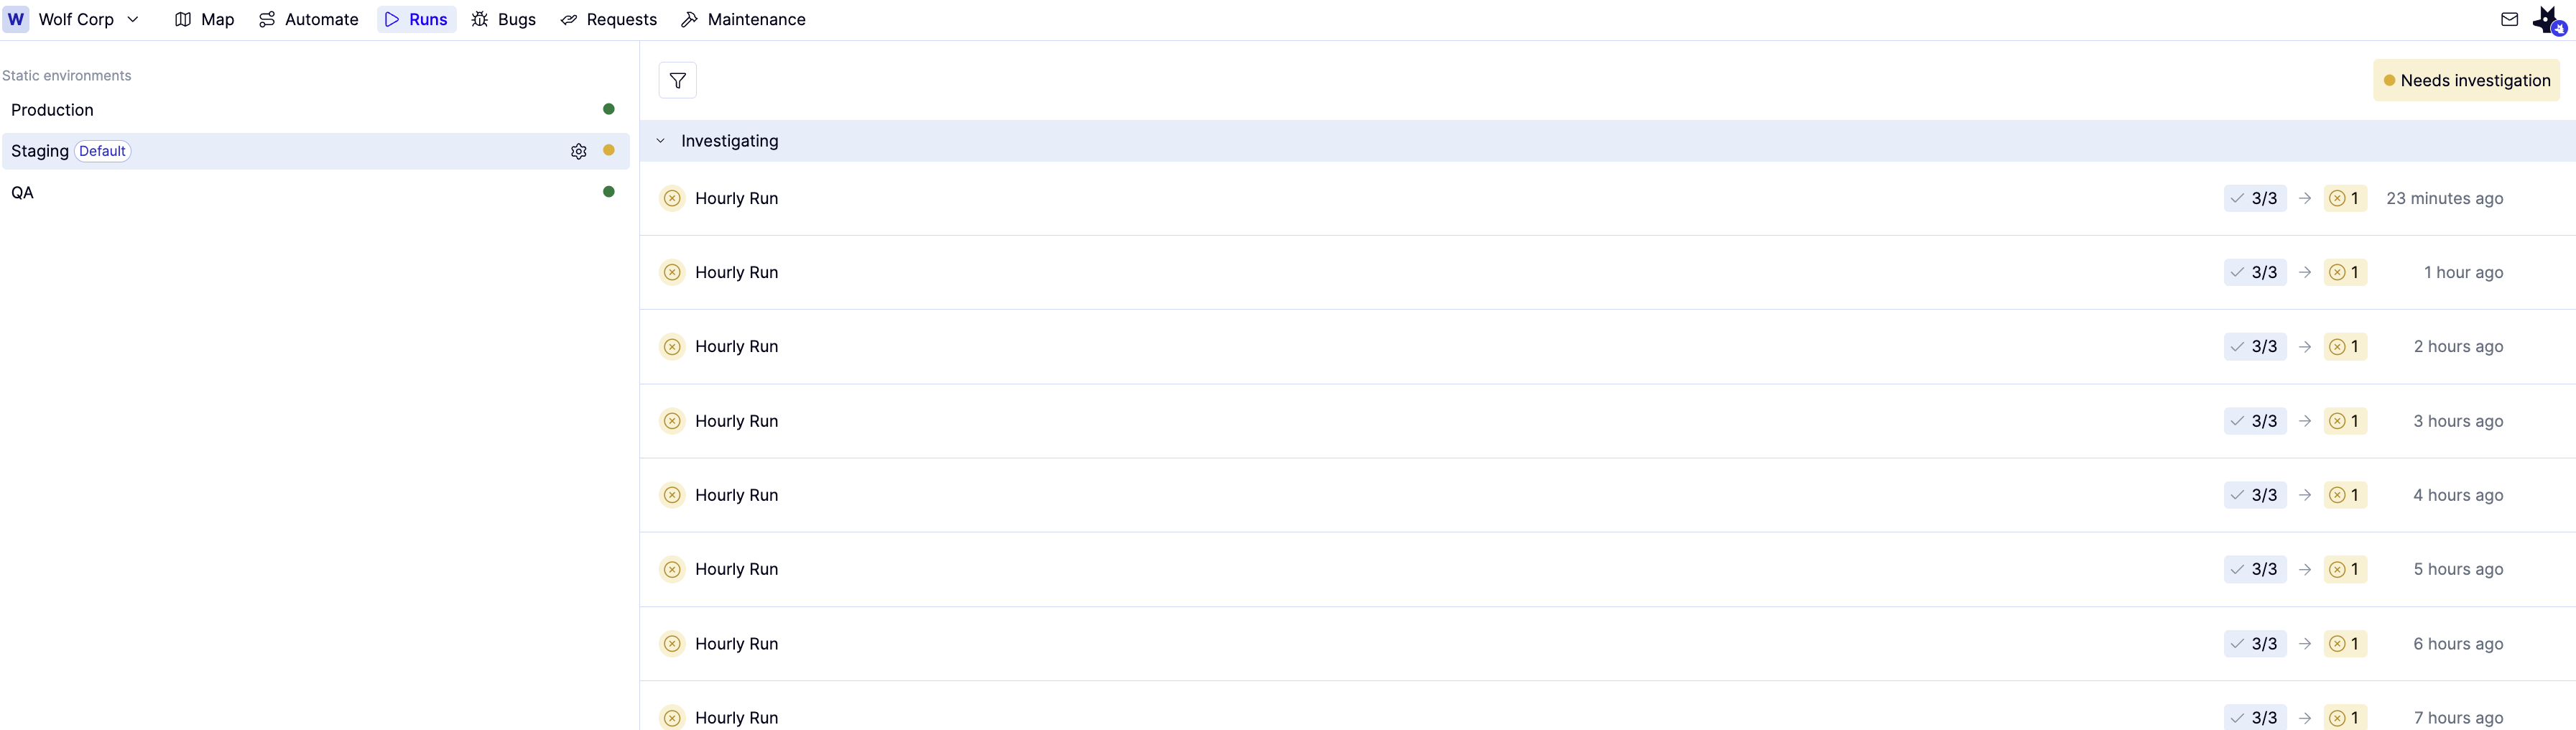
For each run, the list shows:
* The name of the schedule that triggered the run
* — the number of fully passing attempts over total attempts
* — the number of flows still requiring investigation
* — the number of open bug reports linked to flows in the run
* — the number of open maintenance reports linked to flows in the run
* Total wall clock time of the run, including all attempts
 ## Identify environments that need attention
The icon next to each environment name indicates its current status.
| Status | Meaning |
| :----------------------------------------------------------- | :-------------------------------------------------------------------------- |
| Ready | All flows passing |
| Needs investigation | One or more flows failed, or a medium or low priority bug has been reported |
| Failed | A high severity bug has been reported |
You can see environment status in two places:
* On the **Runs** tab, next to each environment name in the list on the left
* On the **Map** tab, in the environment name dropdown
## Review a run
From the **Runs** tab, select the environment you want to investigate.
Runs are grouped into three categories:
* **Investigating** — flows in the run failed and have not been marked *Do Not Investigate*
* **Completed** — all flows have passed or been marked *Do Not Investigate*
* **Canceled** — the run was canceled mid-execution by a subsequent run matching the same branch and environment
Click the run you want to investigate.
## Sort and filter runs
The default view shows past runs sorted by date in descending order. Click the icon to filter by:
* **Created date** — *1 week ago*, *1 month ago*, or *1 year ago*
* **Trigger** — *Hourly* or *Daily*
## Identify environments that need attention
The icon next to each environment name indicates its current status.
| Status | Meaning |
| :----------------------------------------------------------- | :-------------------------------------------------------------------------- |
| Ready | All flows passing |
| Needs investigation | One or more flows failed, or a medium or low priority bug has been reported |
| Failed | A high severity bug has been reported |
You can see environment status in two places:
* On the **Runs** tab, next to each environment name in the list on the left
* On the **Map** tab, in the environment name dropdown
## Review a run
From the **Runs** tab, select the environment you want to investigate.
Runs are grouped into three categories:
* **Investigating** — flows in the run failed and have not been marked *Do Not Investigate*
* **Completed** — all flows have passed or been marked *Do Not Investigate*
* **Canceled** — the run was canceled mid-execution by a subsequent run matching the same branch and environment
Click the run you want to investigate.
## Sort and filter runs
The default view shows past runs sorted by date in descending order. Click the icon to filter by:
* **Created date** — *1 week ago*, *1 month ago*, or *1 year ago*
* **Trigger** — *Hourly* or *Daily*