> ## Documentation Index
> Fetch the complete documentation index at: https://docs.qawolf.com/llms.txt
> Use this file to discover all available pages before exploring further.
# Diagnose the cause of a failing flow
> Learn how to classify flow failures as flakes, bugs, or broken tests using the Investigation view.
## The different reasons flows fail
When a flow fails, the next step is to determine why. Identifying the cause determines the appropriate resolution path and helps avoid unnecessary fixes or retries.
Failures generally fall into one of the following categories:
* **Flakes** — failures caused by infrastructure outages, network instability, or failed dependent services. These issues often resolve without changes to the flow or the application.
* **Bugs** — failures that reveal incorrect or unexpected behavior in the application under test. These indicate a product issue rather than a problem with the flow itself.
* **Broken tests** — failures caused by flow logic, bad selectors, incorrect assertions, or assumptions that no longer match the application. These may be simple to correct or may require more substantial maintenance.
Correctly identifying the cause helps you determine whether the failing flow should be retried, fixed, deferred, or accepted to clear the release.
## Use the Investigation view to diagnose a failure
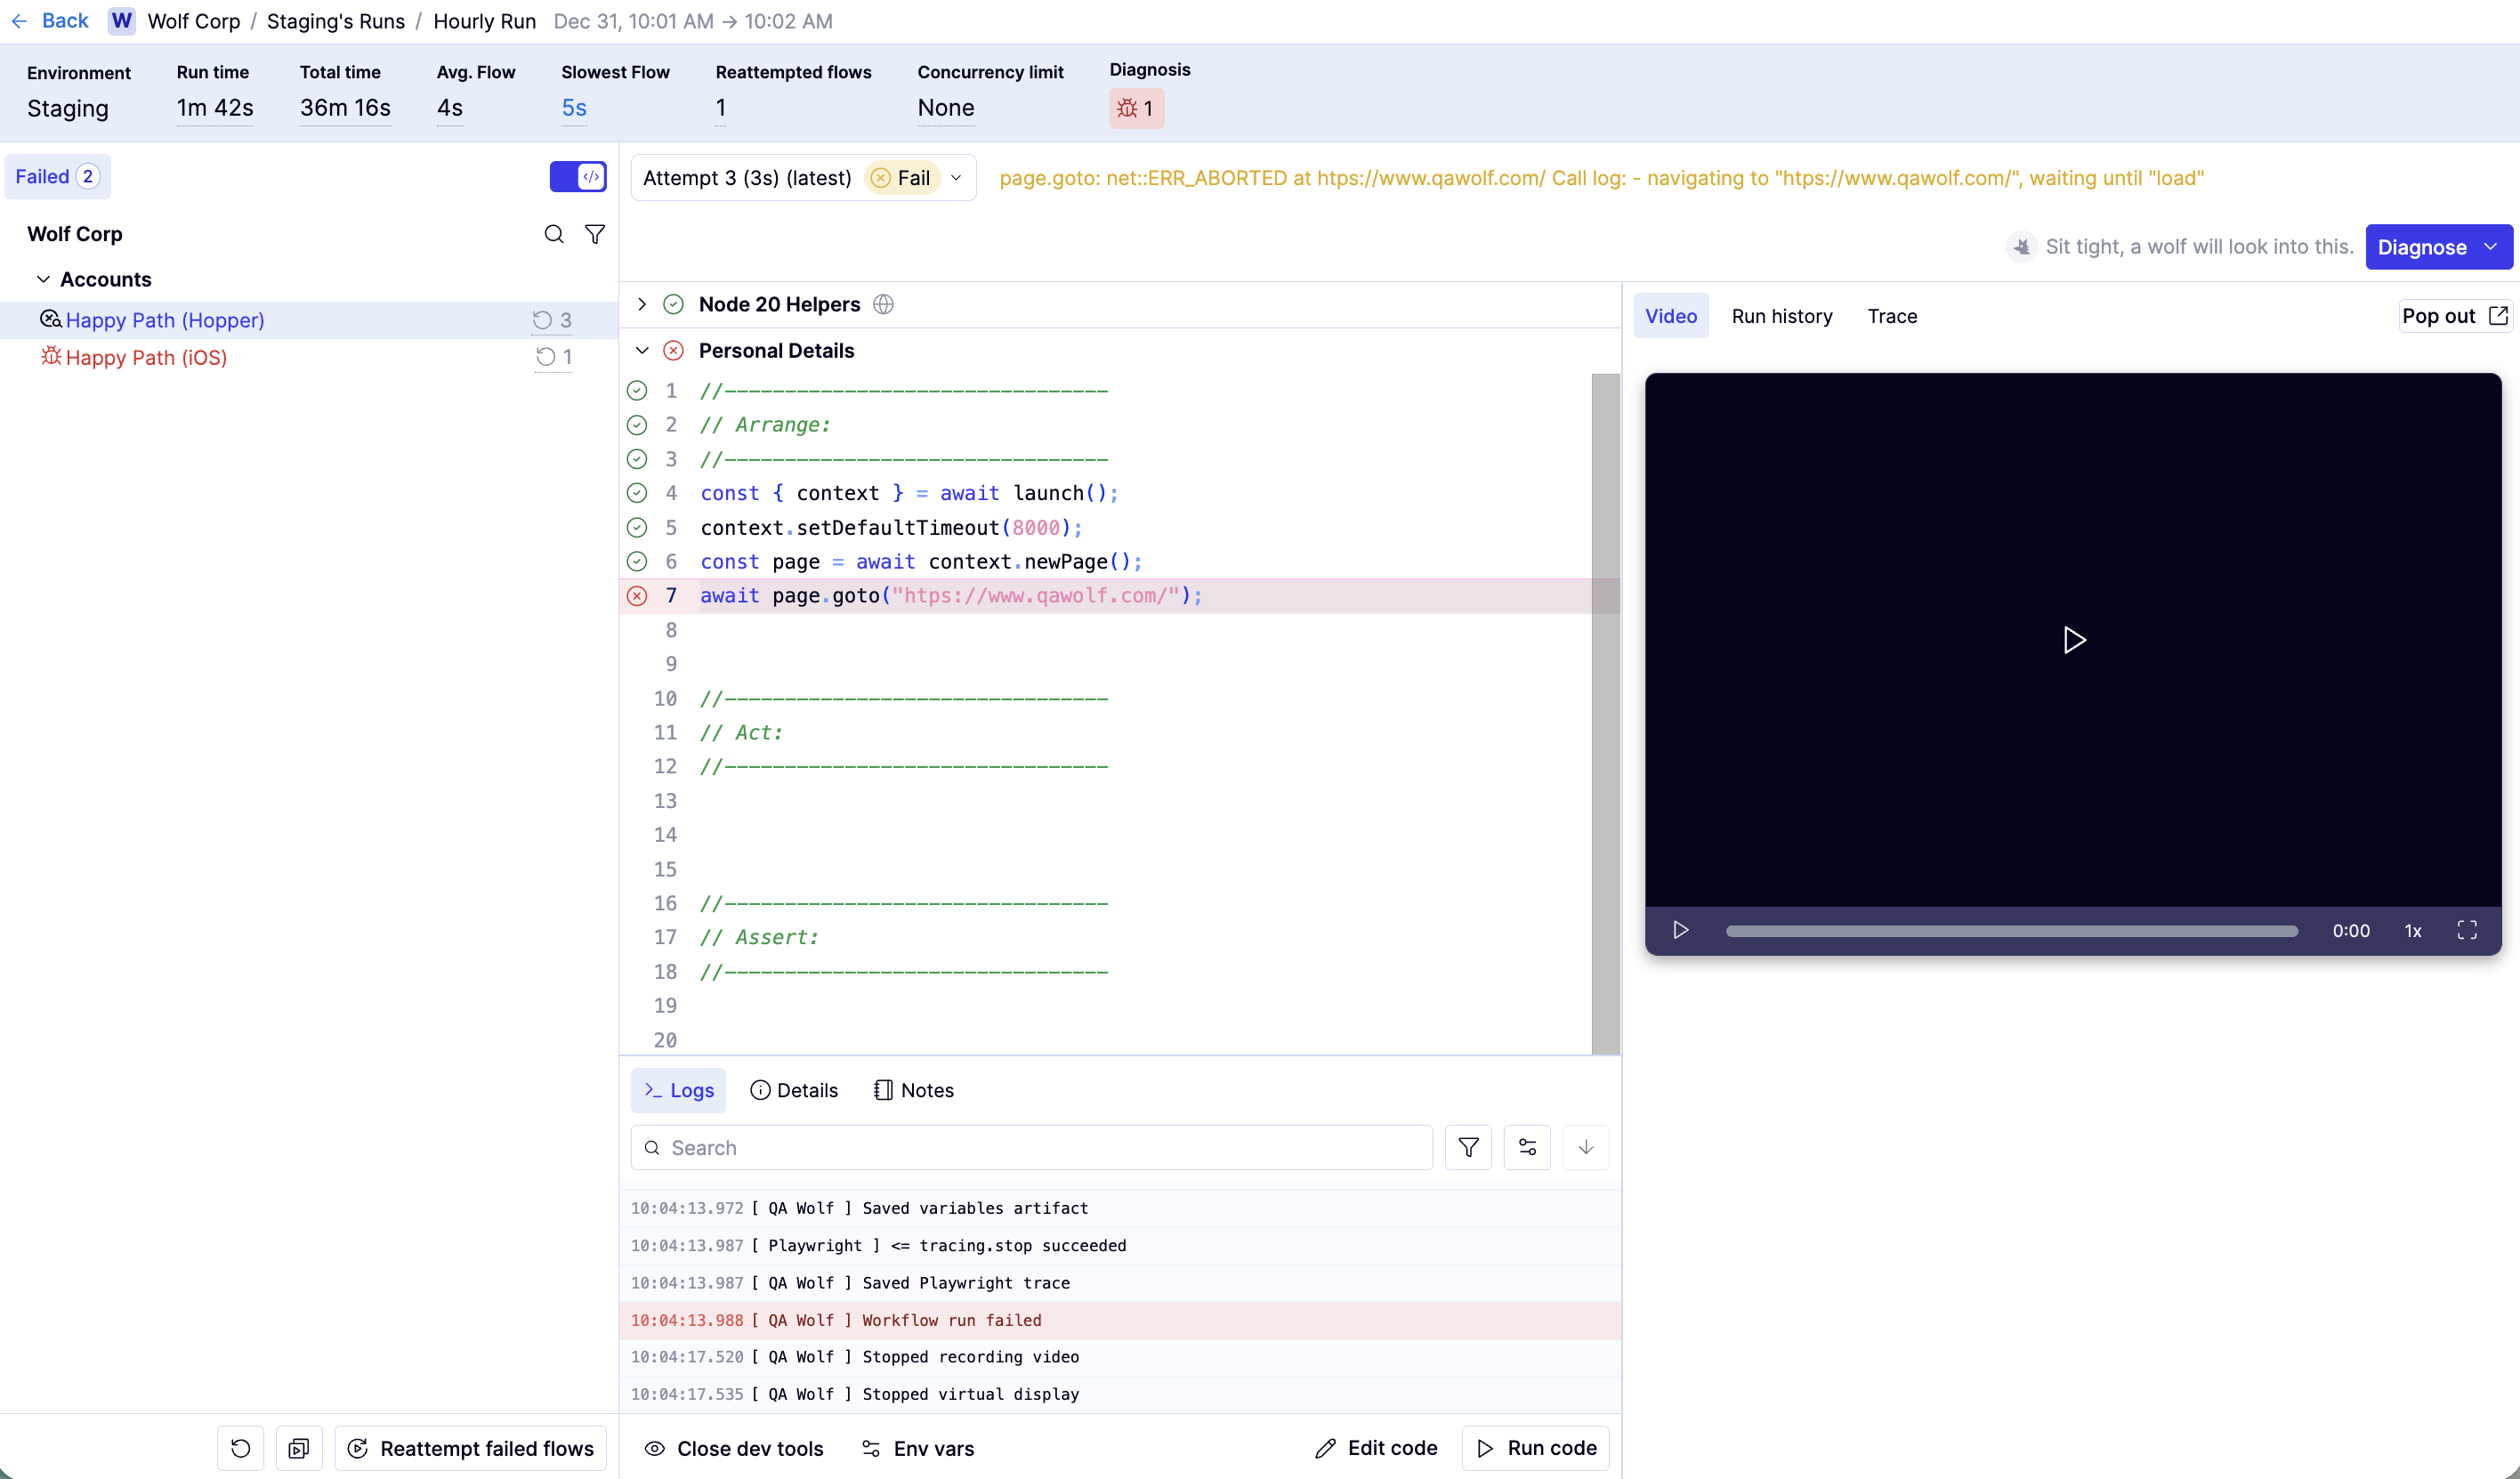
The **Investigation view** is where you diagnose flows that failed during a scheduled or event-based run. It brings together everything you need to understand what happened in a single run and decide what to do next.
You reach the Investigation view by opening a run from the **Runs** tab when that run is in **Investigating** or **Failed** status. The view opens with the most relevant information already selected, so you can start reviewing immediately.
 ### Find failing flows
Navigate to the Investigation view. The left panel separates **Failed**, **Running**, and **Passed** flows.
Click the **Failed** tab to see just those flows.
### Find failing flows
Navigate to the Investigation view. The left panel separates **Failed**, **Running**, and **Passed** flows.
Click the **Failed** tab to see just those flows.
 ### Identify the failing line of code
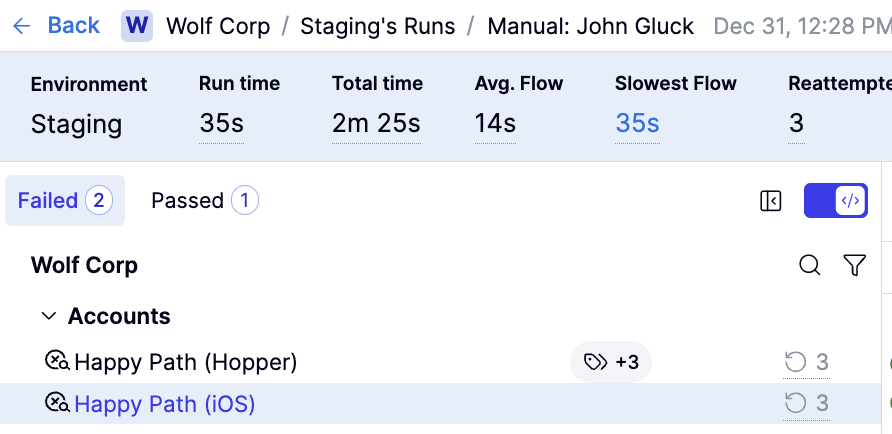
Navigate to the failing flows in the Investigation view.
Select a flow. The point of failure is highlighted.
### Identify the failing line of code
Navigate to the failing flows in the Investigation view.
Select a flow. The point of failure is highlighted.
 ### Compare attempts in a single run
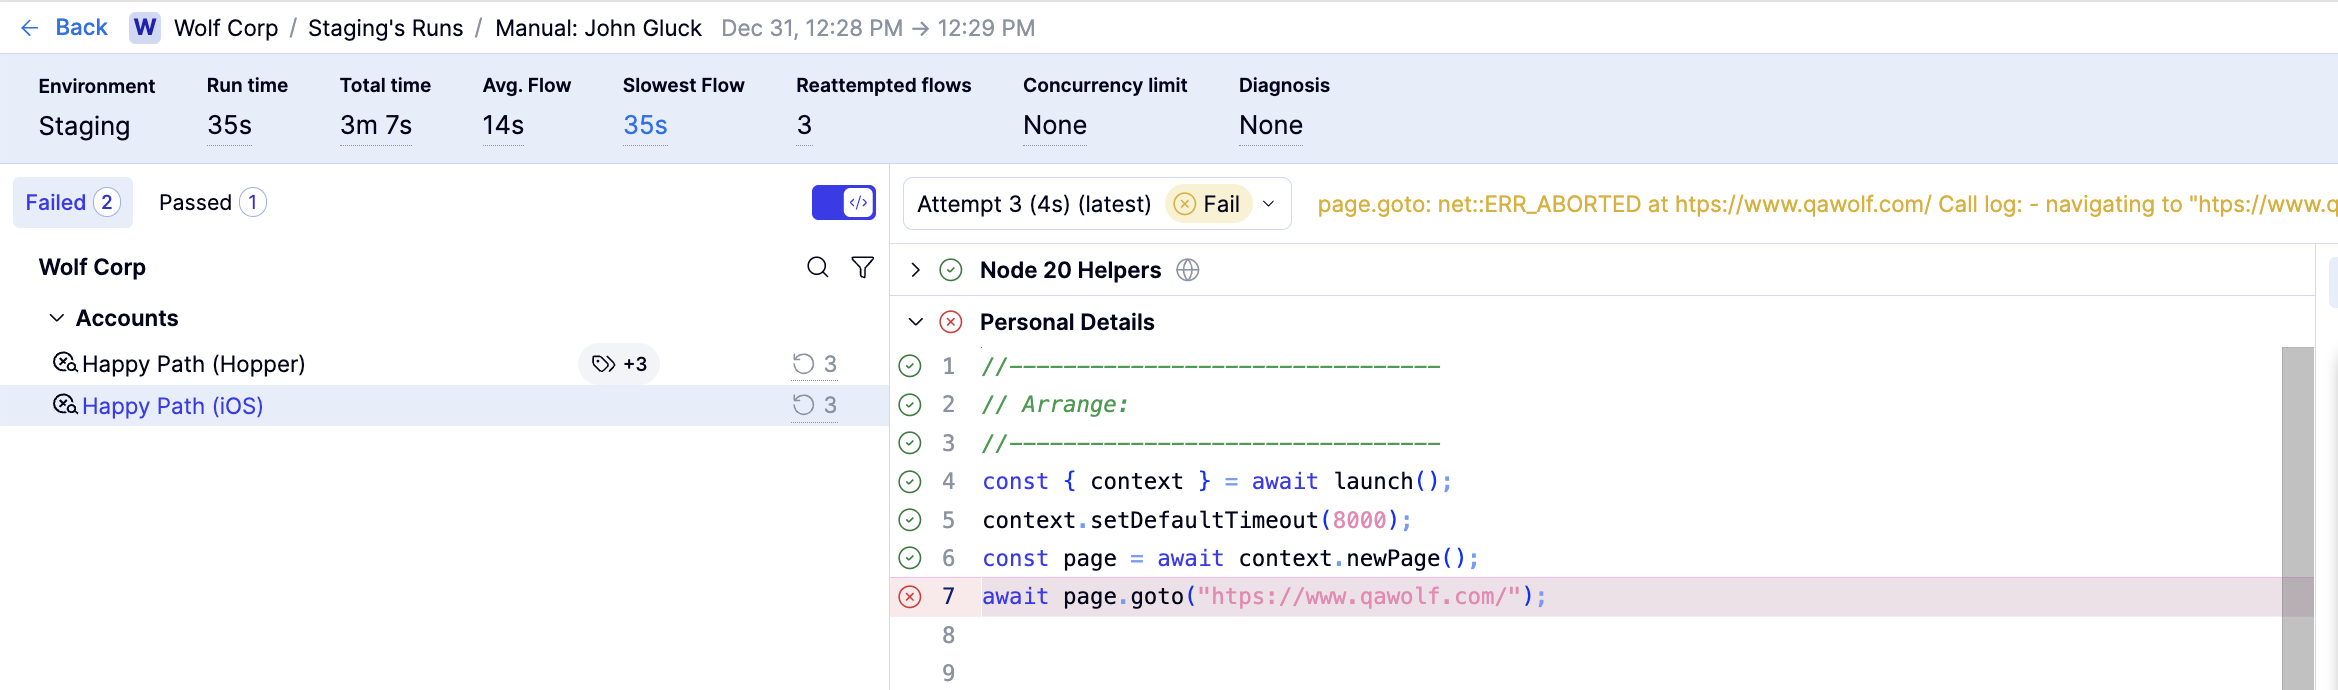
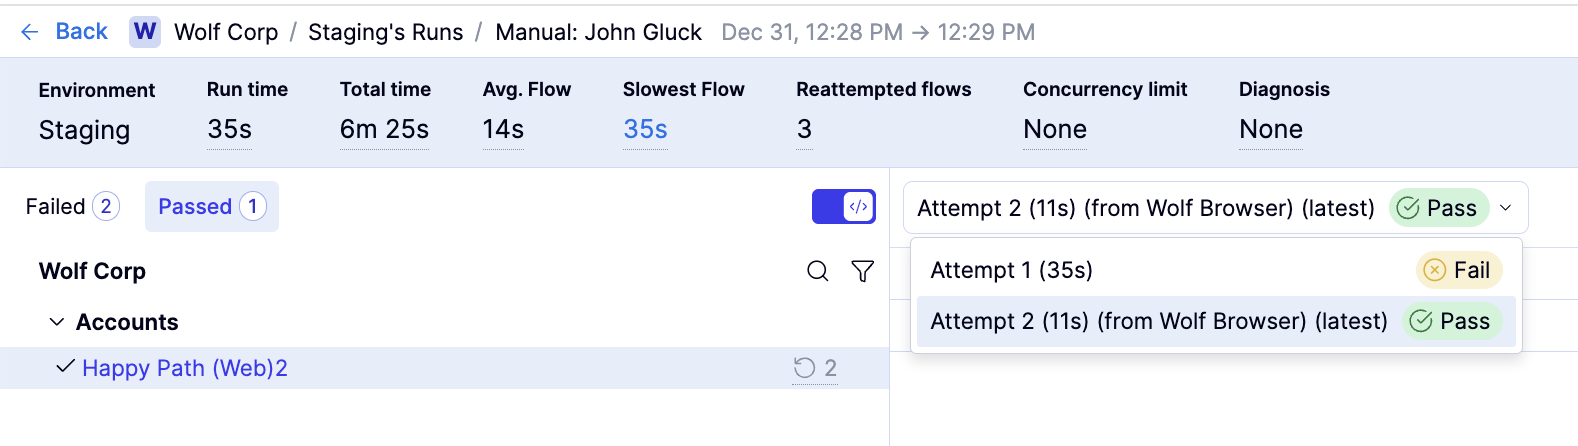
If a flow was retried multiple times during a run, you can switch between attempts to determine whether the failure was consistent or occurred only under certain conditions.
### Compare attempts in a single run
If a flow was retried multiple times during a run, you can switch between attempts to determine whether the failure was consistent or occurred only under certain conditions.
 ### Review what happened in the browser during the most recent run
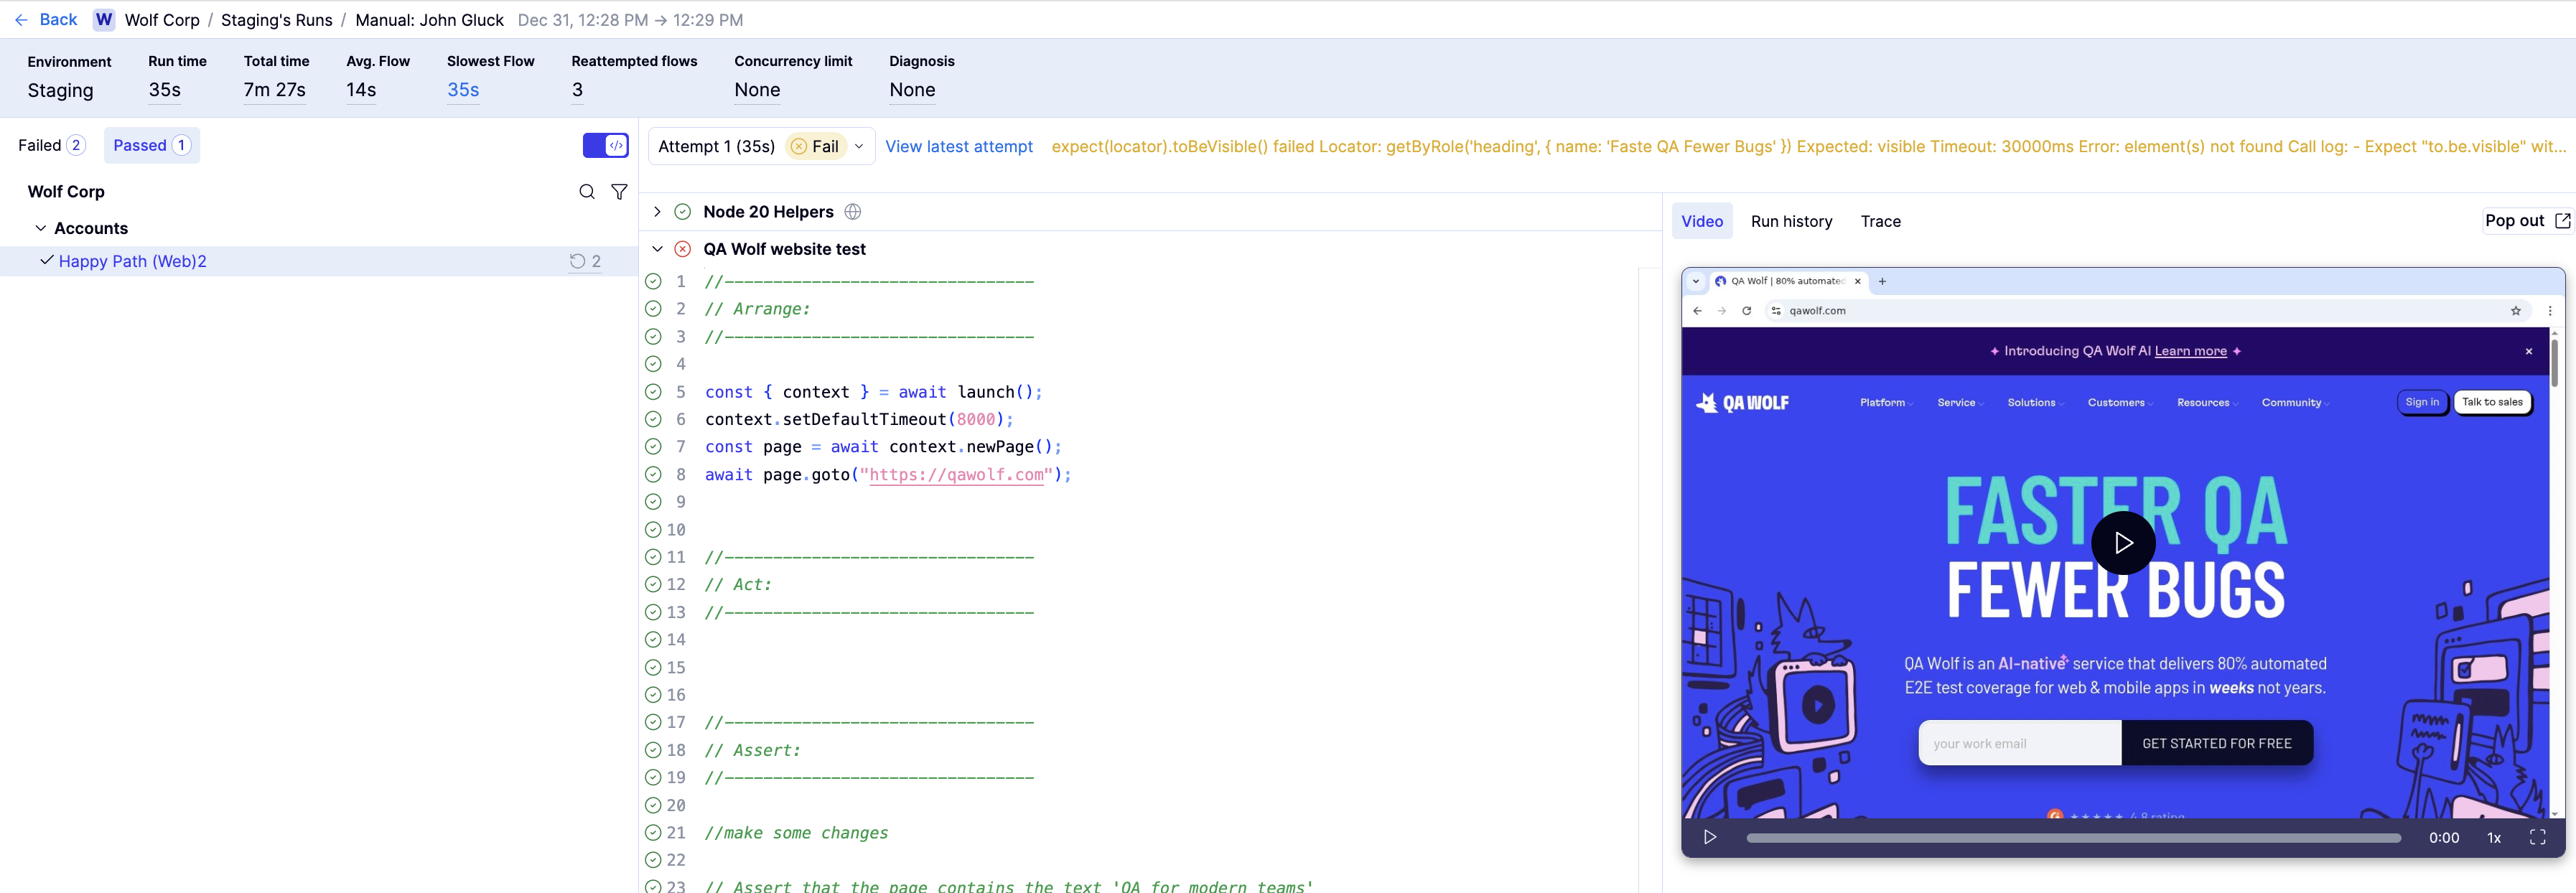
Recorded video shows exactly what happened in the browser during the selected attempt, which is often the fastest way to understand unexpected behavior.
### Review what happened in the browser during the most recent run
Recorded video shows exactly what happened in the browser during the selected attempt, which is often the fastest way to understand unexpected behavior.
 ### Compare previous runs
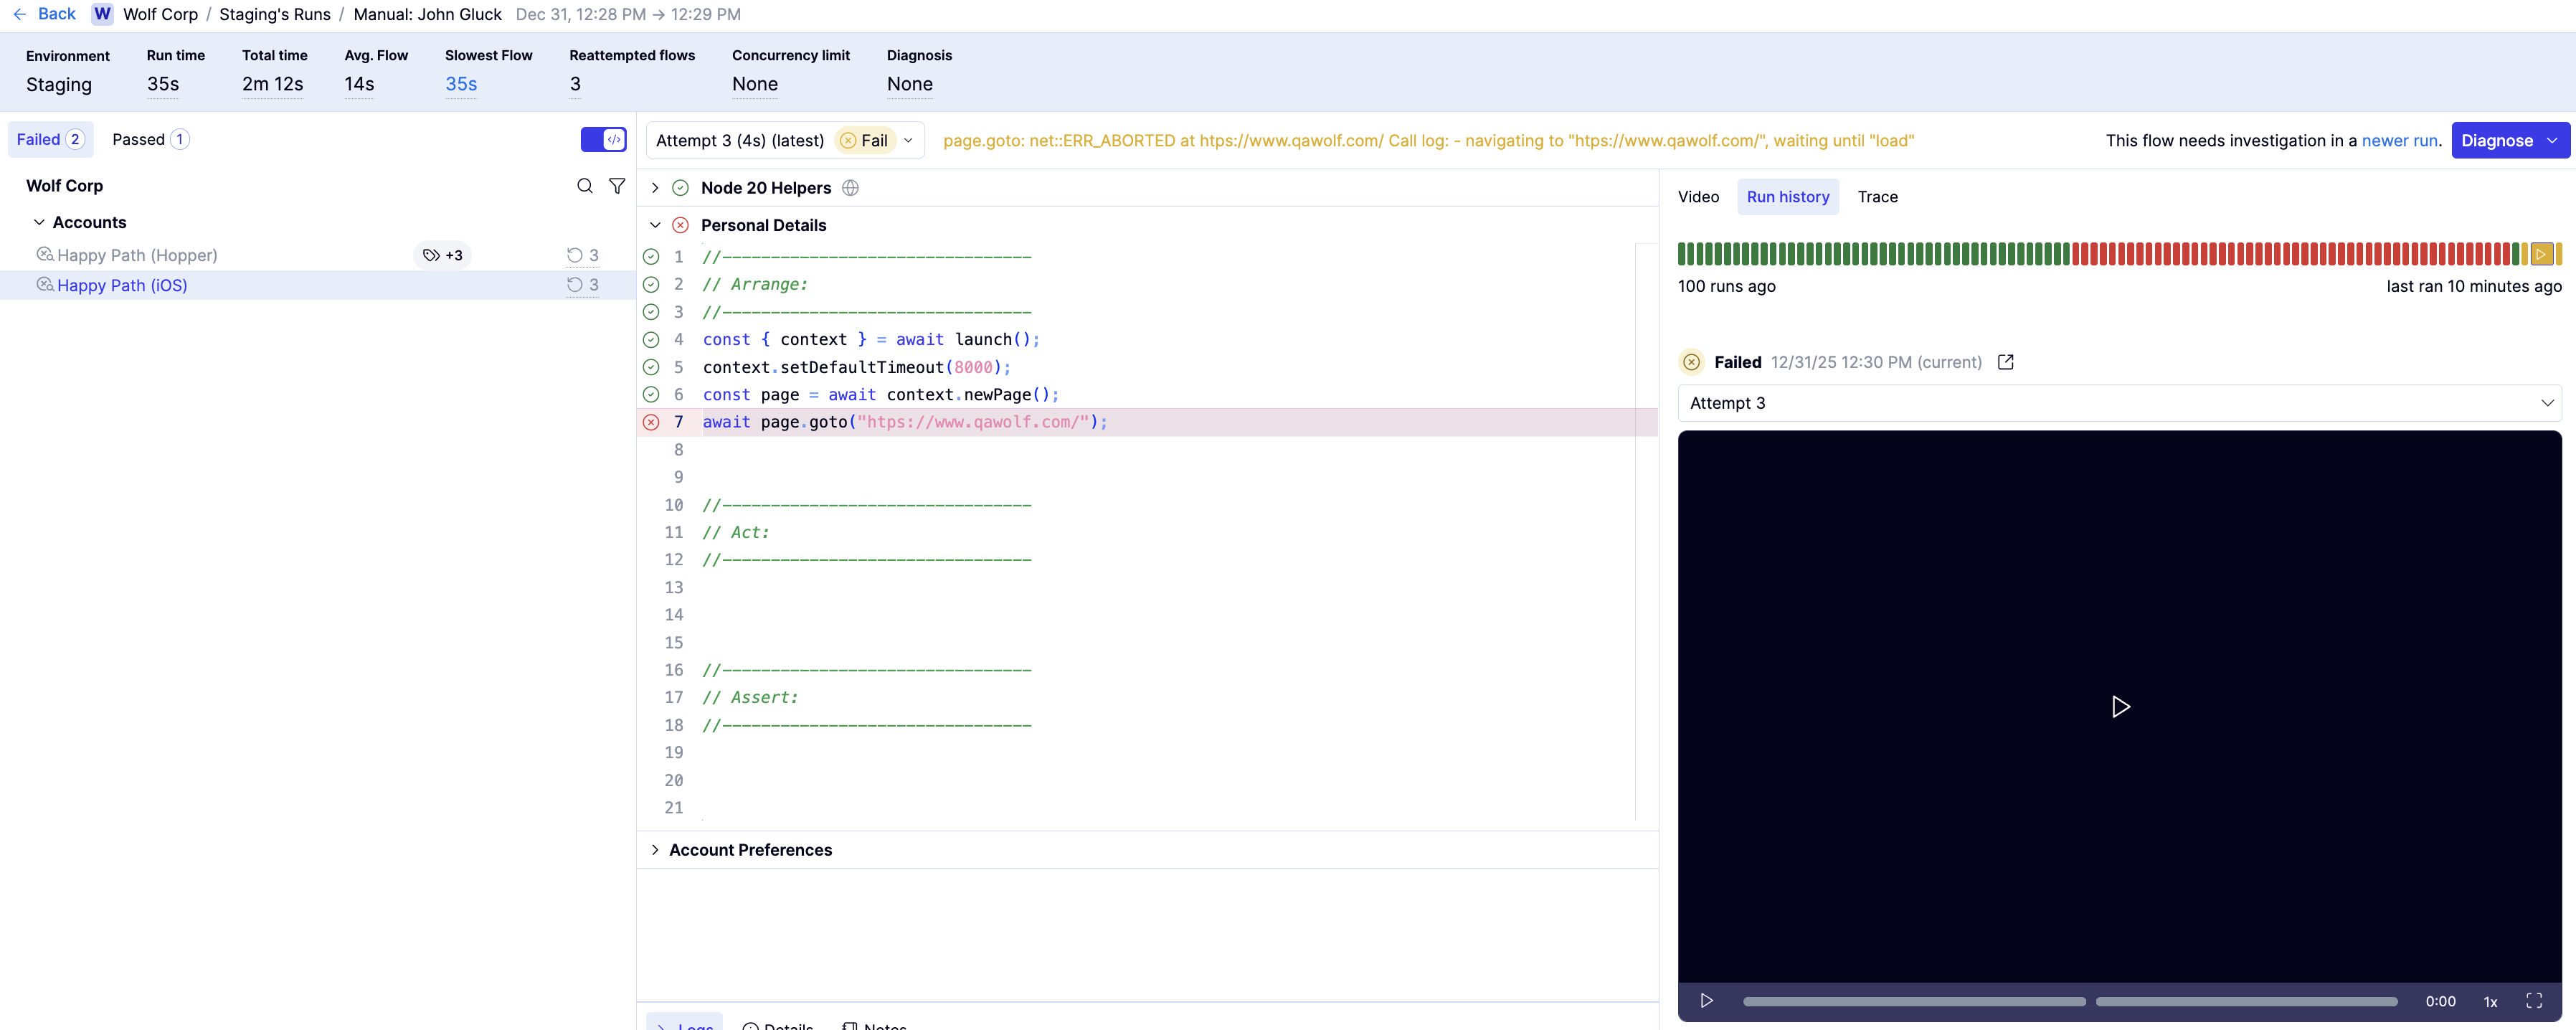
To review video of up to the last 100 runs of a flow, including all attempts, use the flow's **Run History** tab.
### Compare previous runs
To review video of up to the last 100 runs of a flow, including all attempts, use the flow's **Run History** tab.
 ### Access Playwright traces
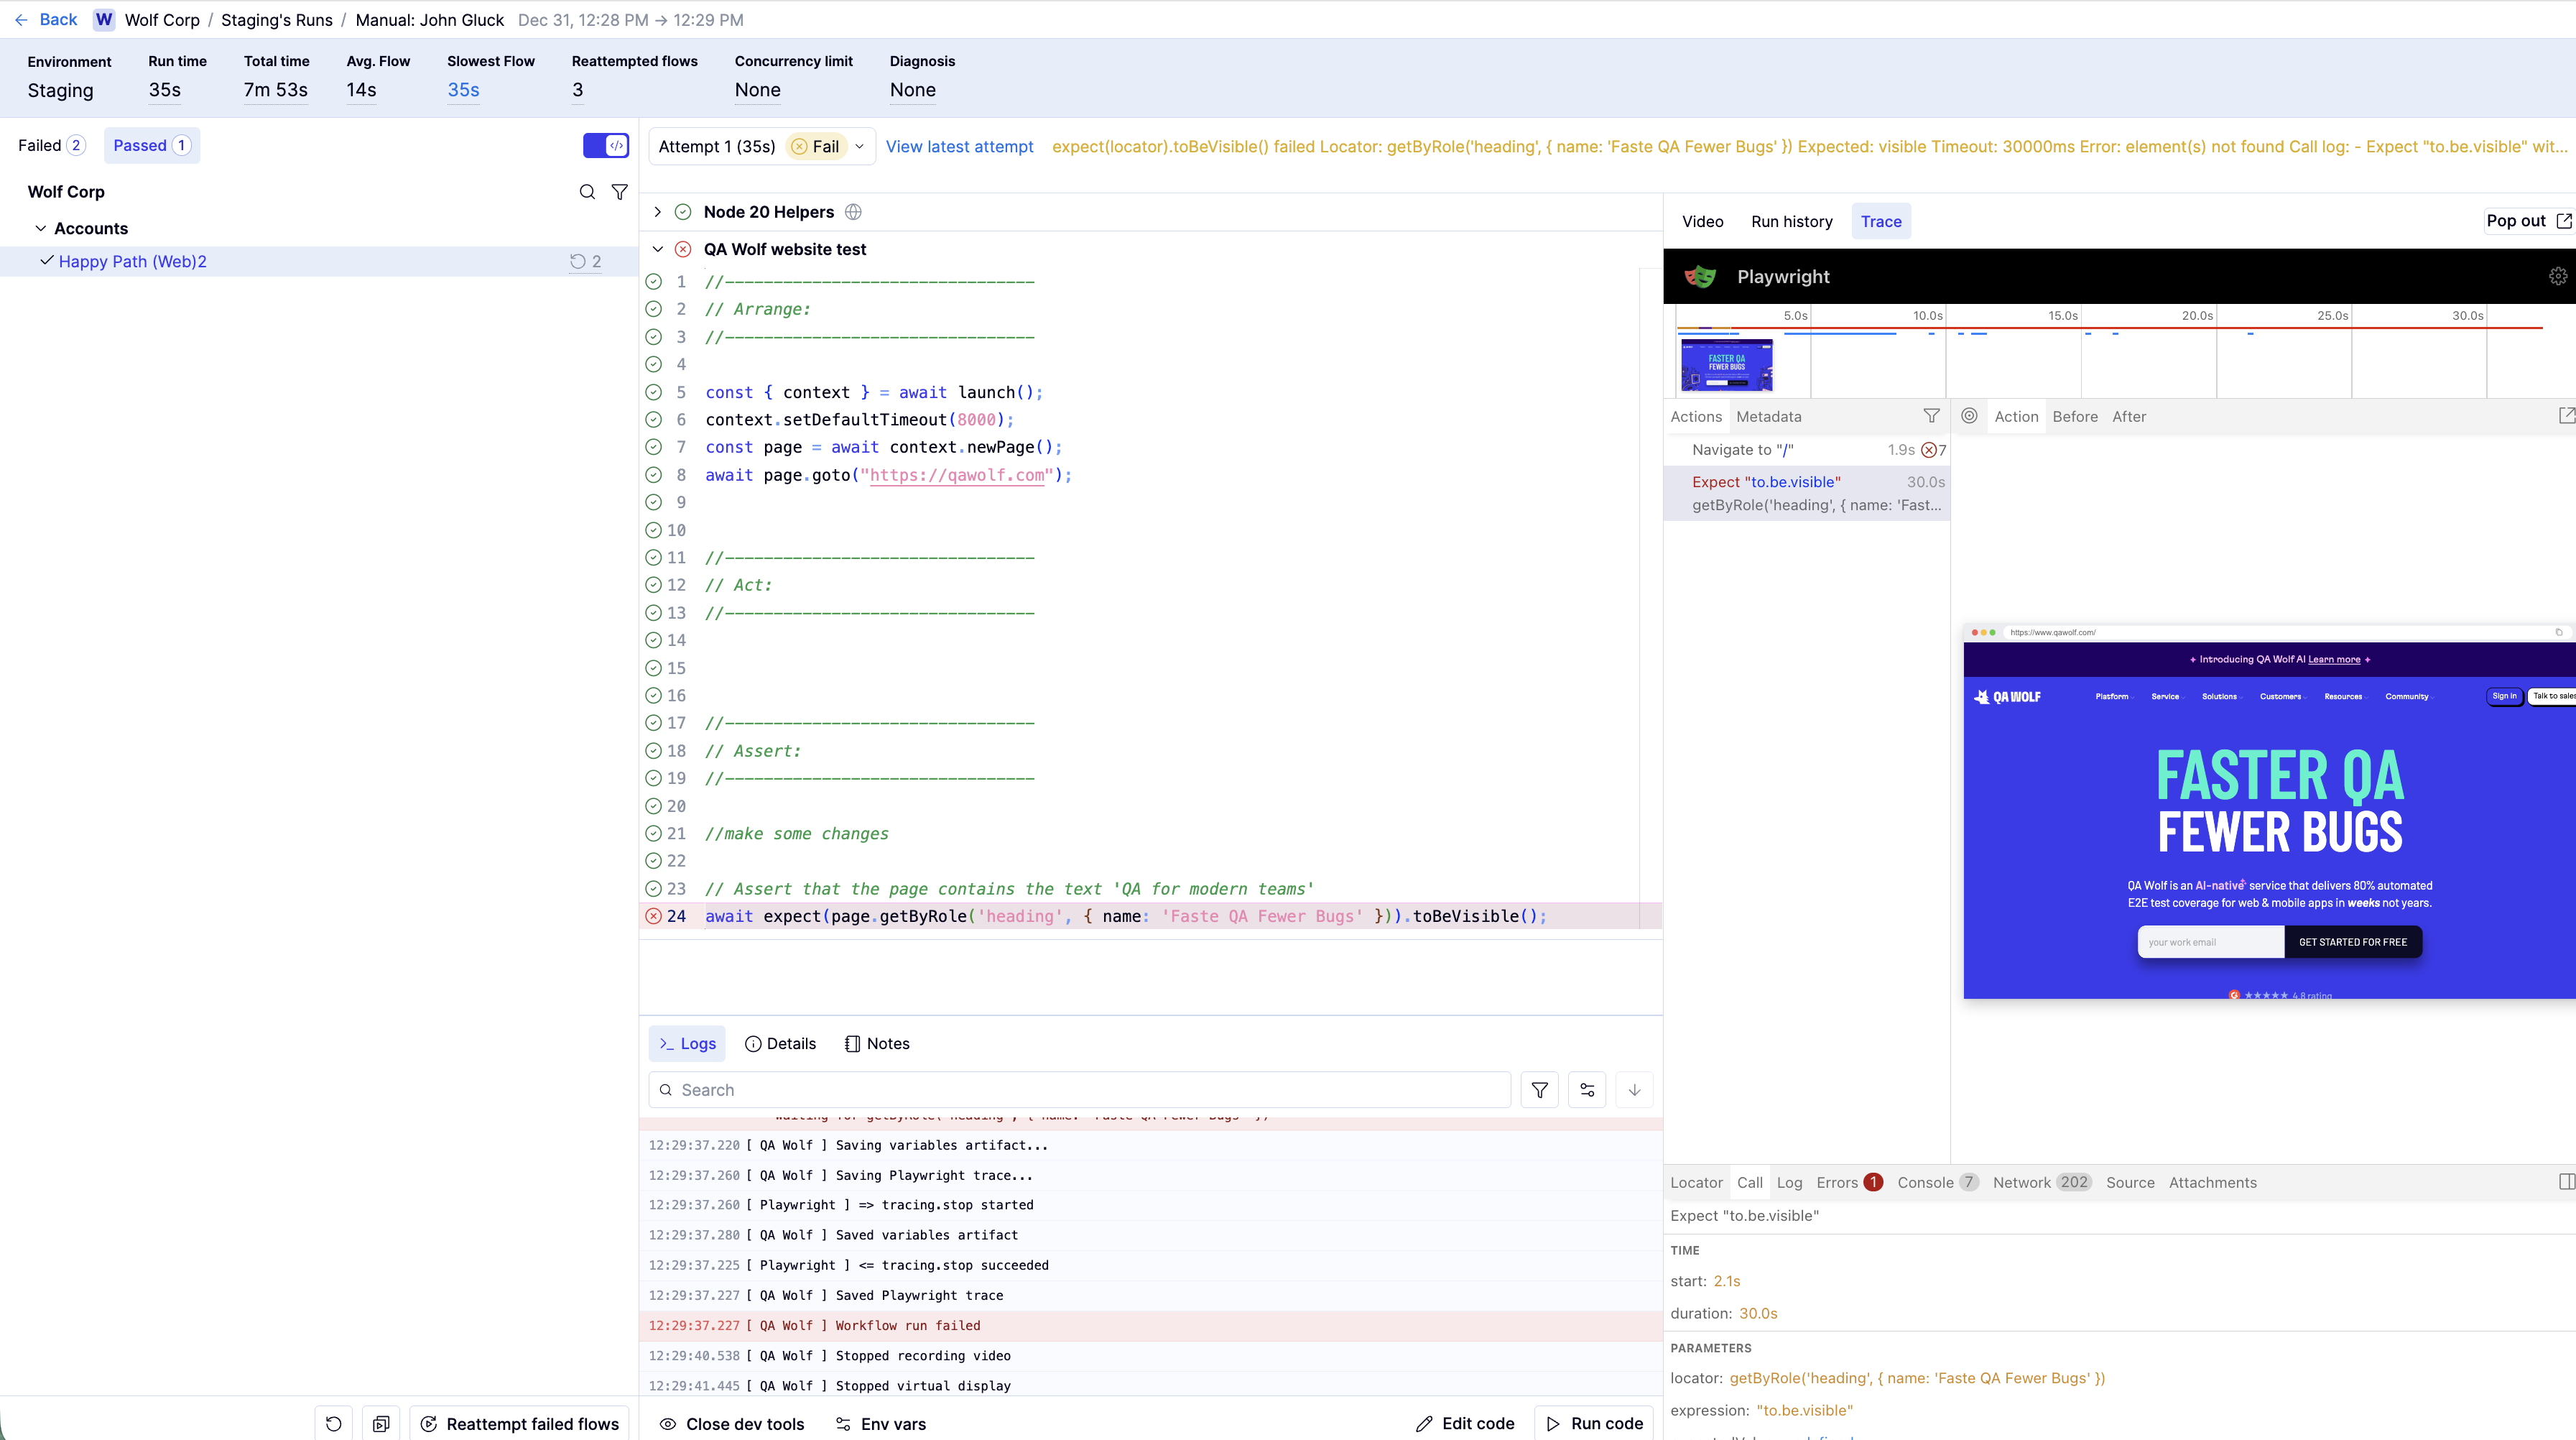
Navigate to the failing flow from the Investigation view.
Click the **Trace** tab on the right panel.
### Access Playwright traces
Navigate to the failing flow from the Investigation view.
Click the **Trace** tab on the right panel.
 ## Use Run History, Activity, and Notes to diagnose failures
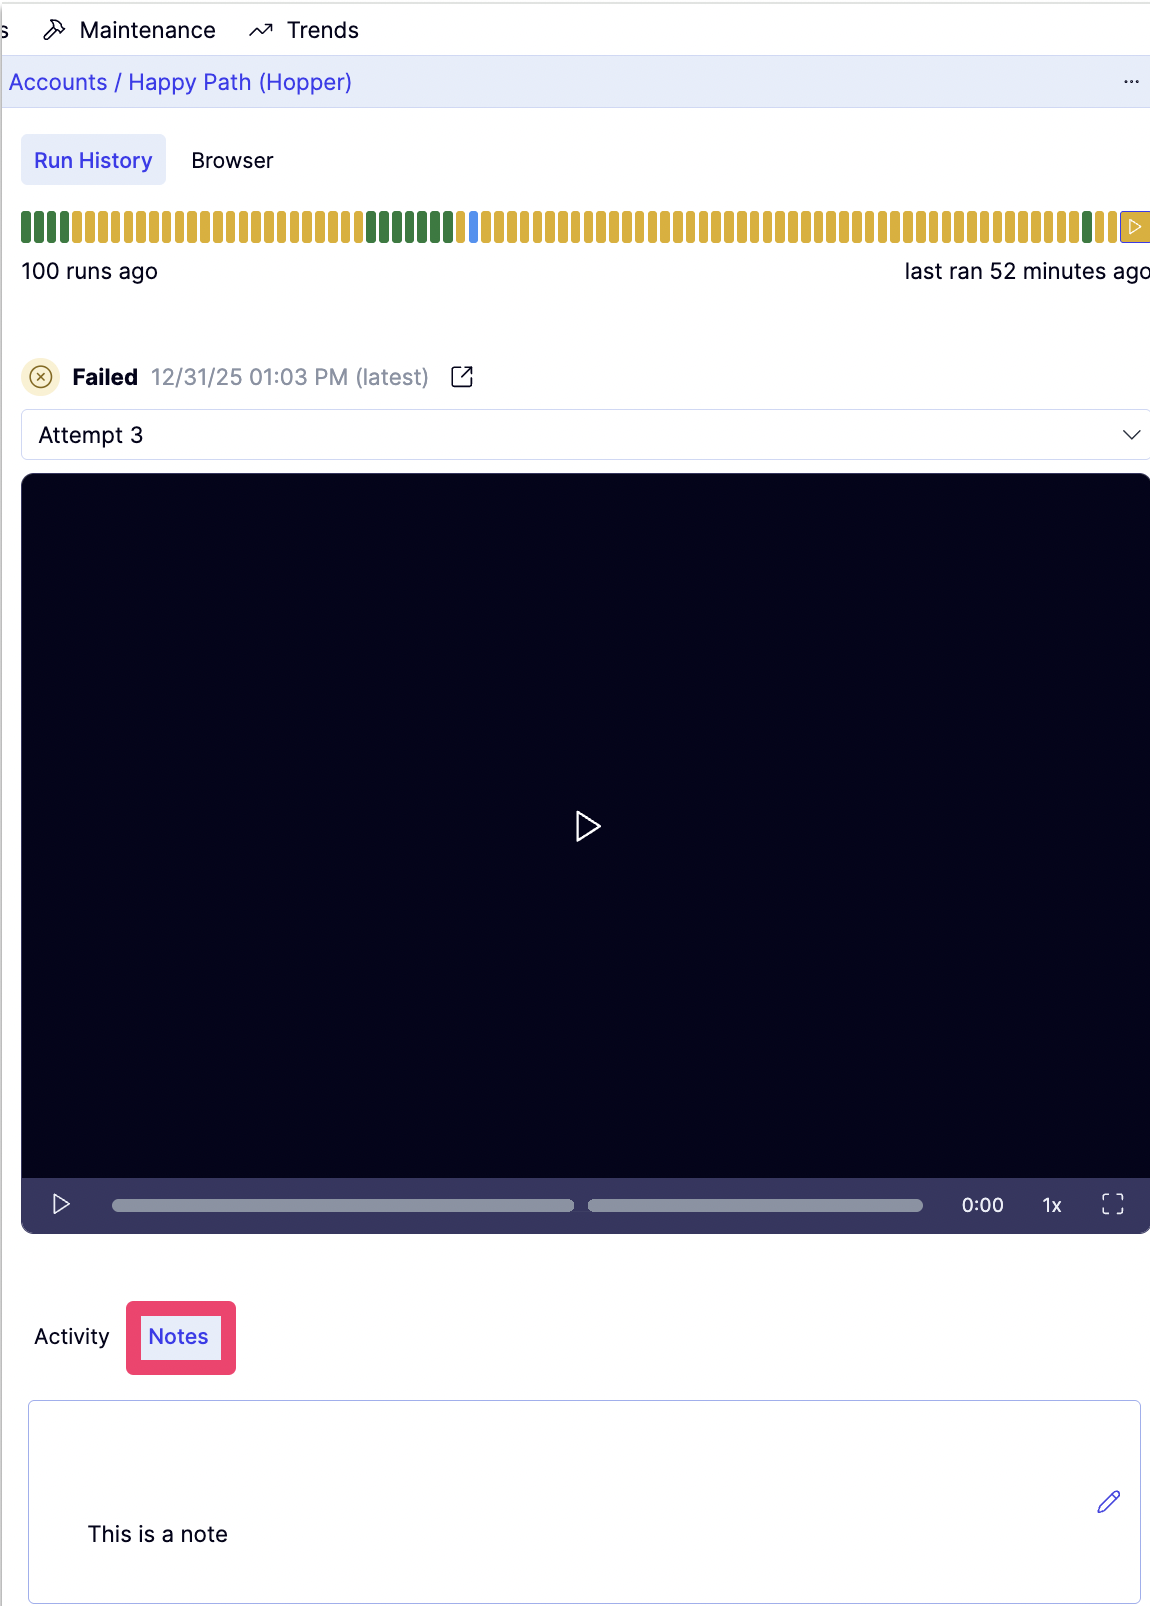
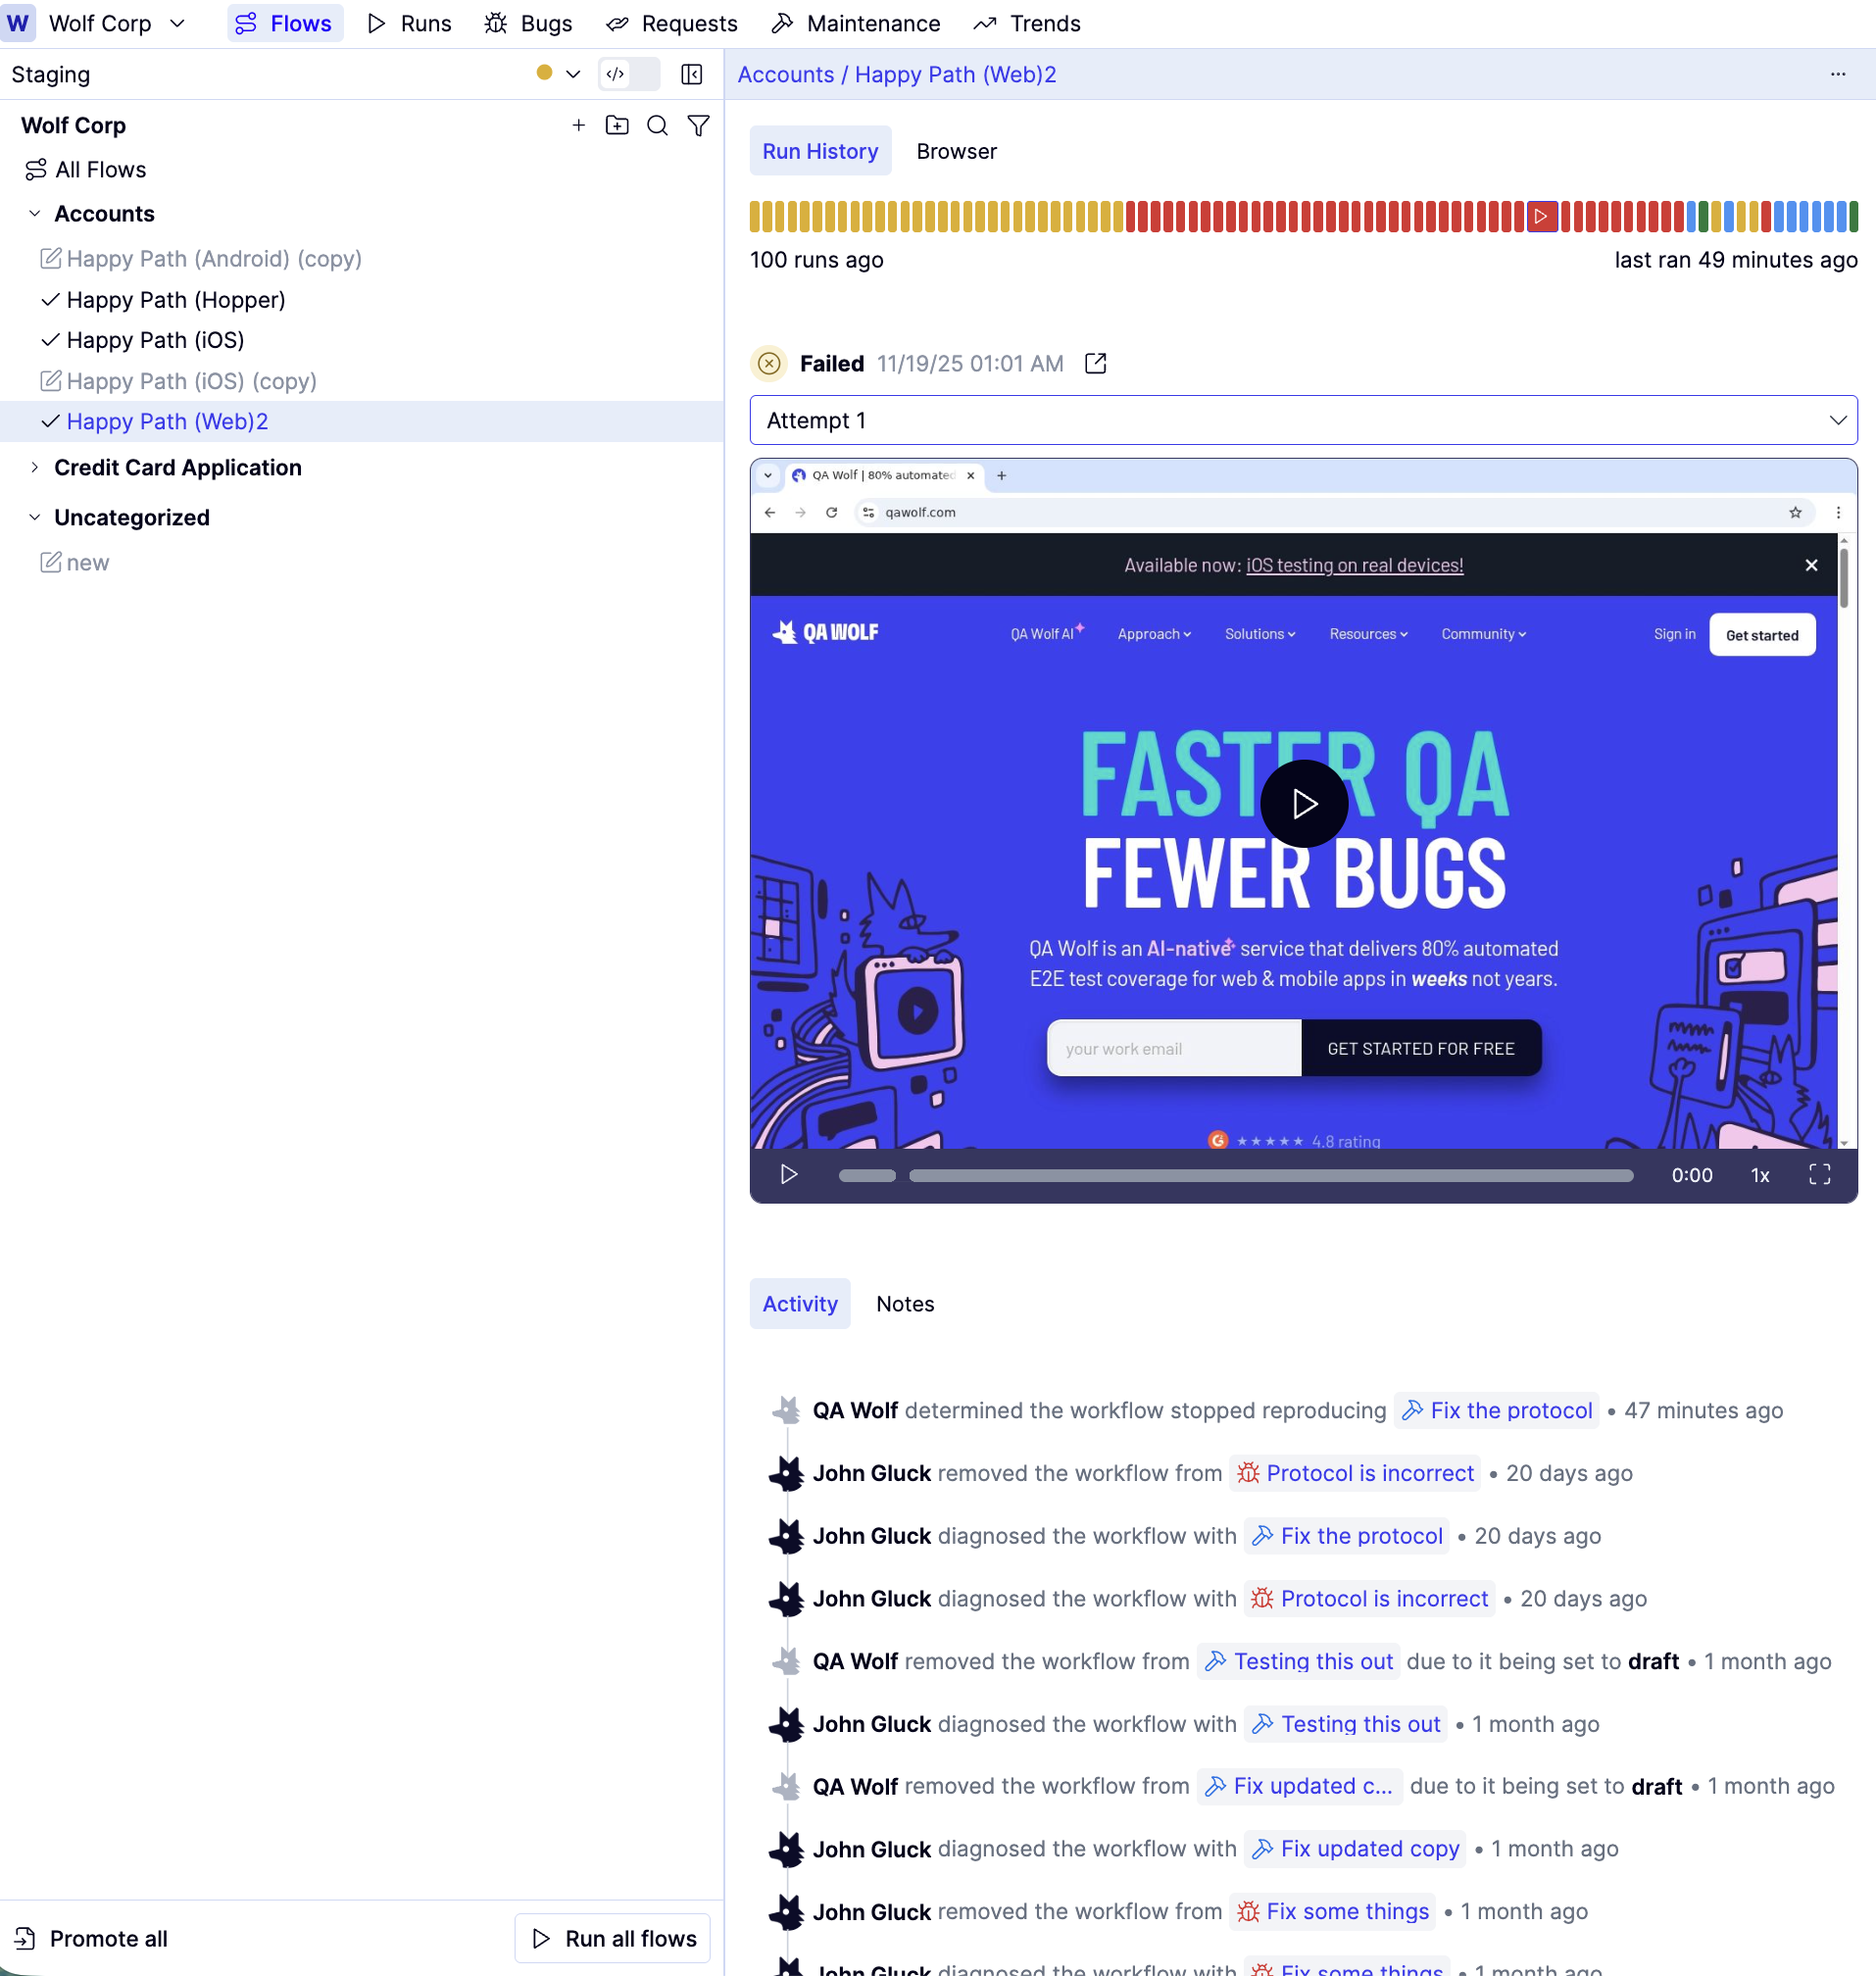
Some issues only become clear when you look beyond a single run. **Run History** shows the last 100 runs for a flow, including each attempt. Reviewing this history helps you spot patterns such as intermittent failures, regressions after changes, or flows that consistently fail in the same place.
You'll typically access these tools from the Investigation view or the **Run History** tab in the Automate editor.
## Use Run History, Activity, and Notes to diagnose failures
Some issues only become clear when you look beyond a single run. **Run History** shows the last 100 runs for a flow, including each attempt. Reviewing this history helps you spot patterns such as intermittent failures, regressions after changes, or flows that consistently fail in the same place.
You'll typically access these tools from the Investigation view or the **Run History** tab in the Automate editor.
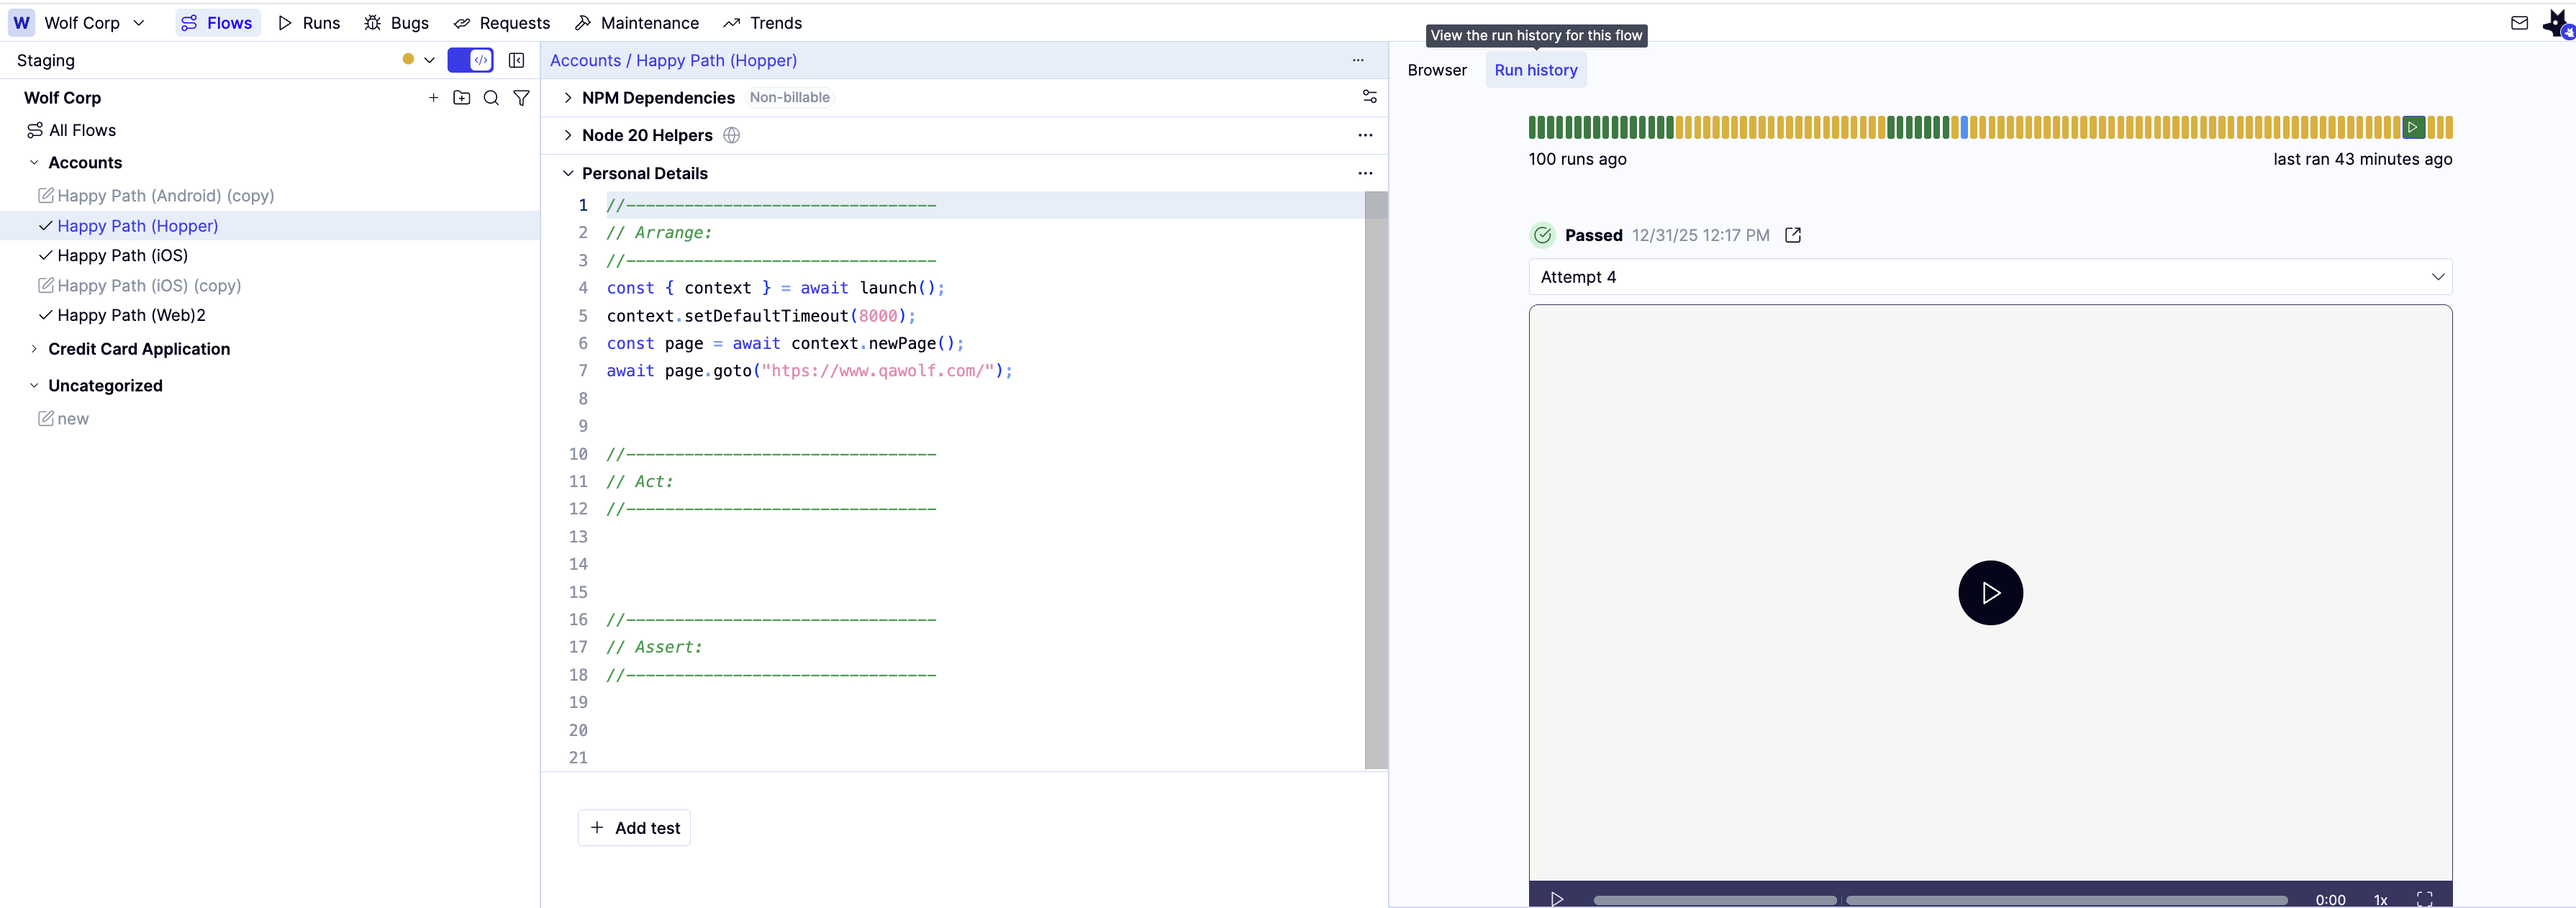
 Run History is also available in the Automate editor — select a flow and click the **Run History** tab in the right panel.
### Focus on a specific run
Hover over the vertical bars in the **Run History** timeline.
As you move across the bars, the selected bar expands to show the icon, and the timestamp below the timeline updates to match that run.
Click the icon to open details for the selected run.
Run History is also available in the Automate editor — select a flow and click the **Run History** tab in the right panel.
### Focus on a specific run
Hover over the vertical bars in the **Run History** timeline.
As you move across the bars, the selected bar expands to show the icon, and the timestamp below the timeline updates to match that run.
Click the icon to open details for the selected run.
 ### Review change history
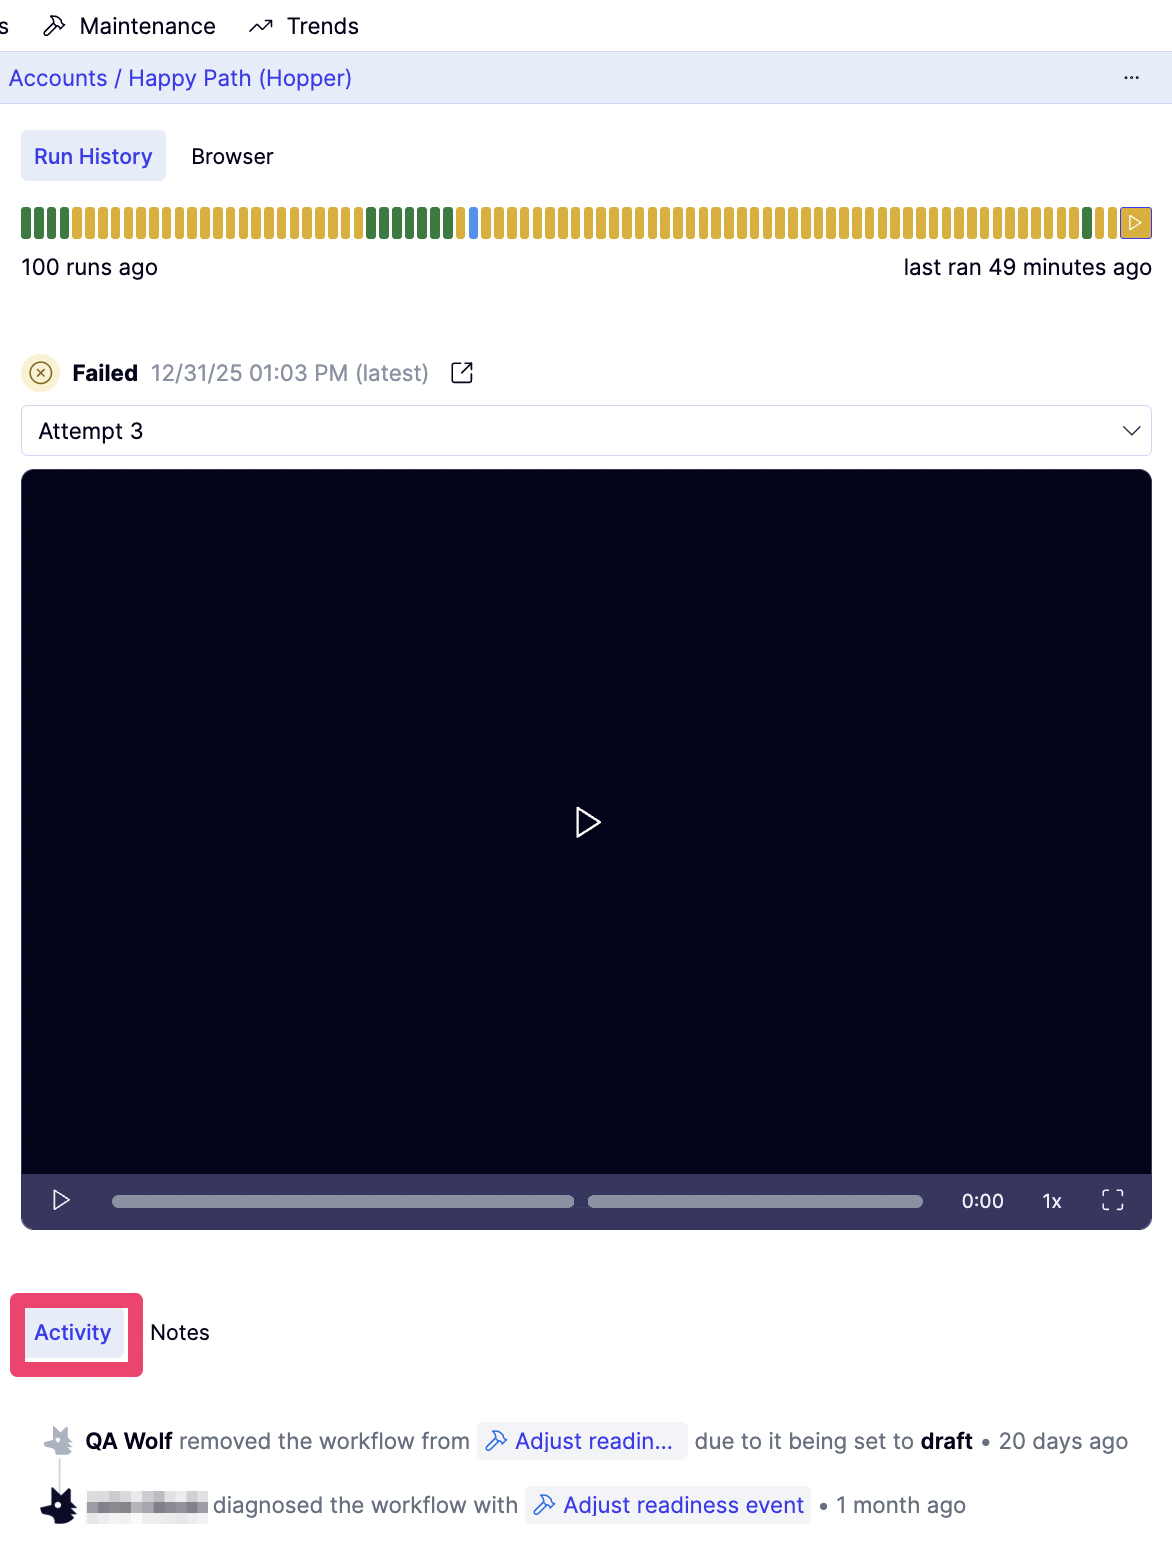
The **Activity** tab shows changes made to a flow over time, including readiness updates and maintenance reports. This helps explain when a flow was modified or temporarily removed from runs and why.
### Review change history
The **Activity** tab shows changes made to a flow over time, including readiness updates and maintenance reports. This helps explain when a flow was modified or temporarily removed from runs and why.
 ### Record and review notes
The **Notes** tab lets you record context about a flow, such as known issues, edge cases, or investigation findings. Notes are saved per flow and can help guide future diagnosis and maintenance.
### Record and review notes
The **Notes** tab lets you record context about a flow, such as known issues, edge cases, or investigation findings. Notes are saved per flow and can help guide future diagnosis and maintenance.