> ## Documentation Index
> Fetch the complete documentation index at: https://docs.qawolf.com/llms.txt
> Use this file to discover all available pages before exploring further.
# How to verify and debug your test
> Run your test code in a live browser, identify failures, and use debugging tools to fix issues.
## Run your flow
Click **Run** to execute the flow. A live browser appears in the right panel where you can watch the code execute in real time.
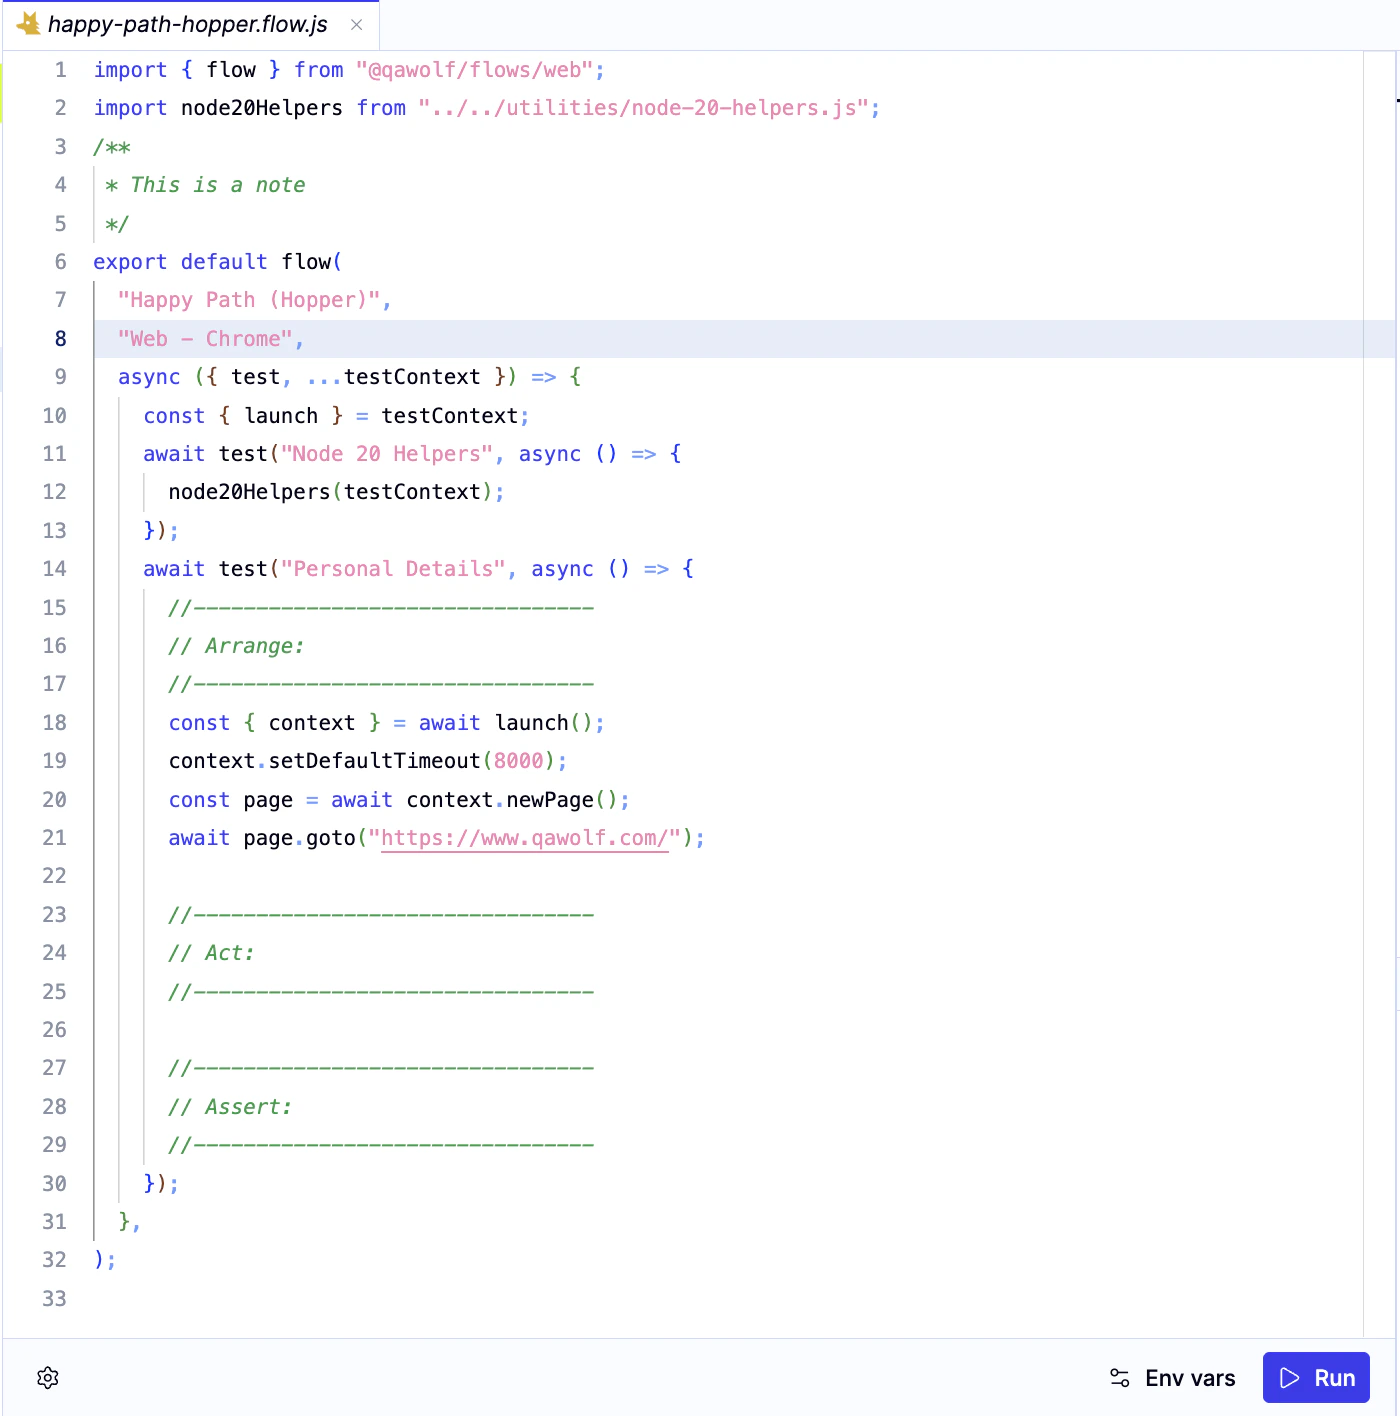 When the flow completes successfully, a green **Flow passed** banner appears at the top of the editor.
## Debug a failure
If something goes wrong, a red **Flow failed** banner appears at the top of the editor and the failed line is highlighted in red.
When the flow completes successfully, a green **Flow passed** banner appears at the top of the editor.
## Debug a failure
If something goes wrong, a red **Flow failed** banner appears at the top of the editor and the failed line is highlighted in red.
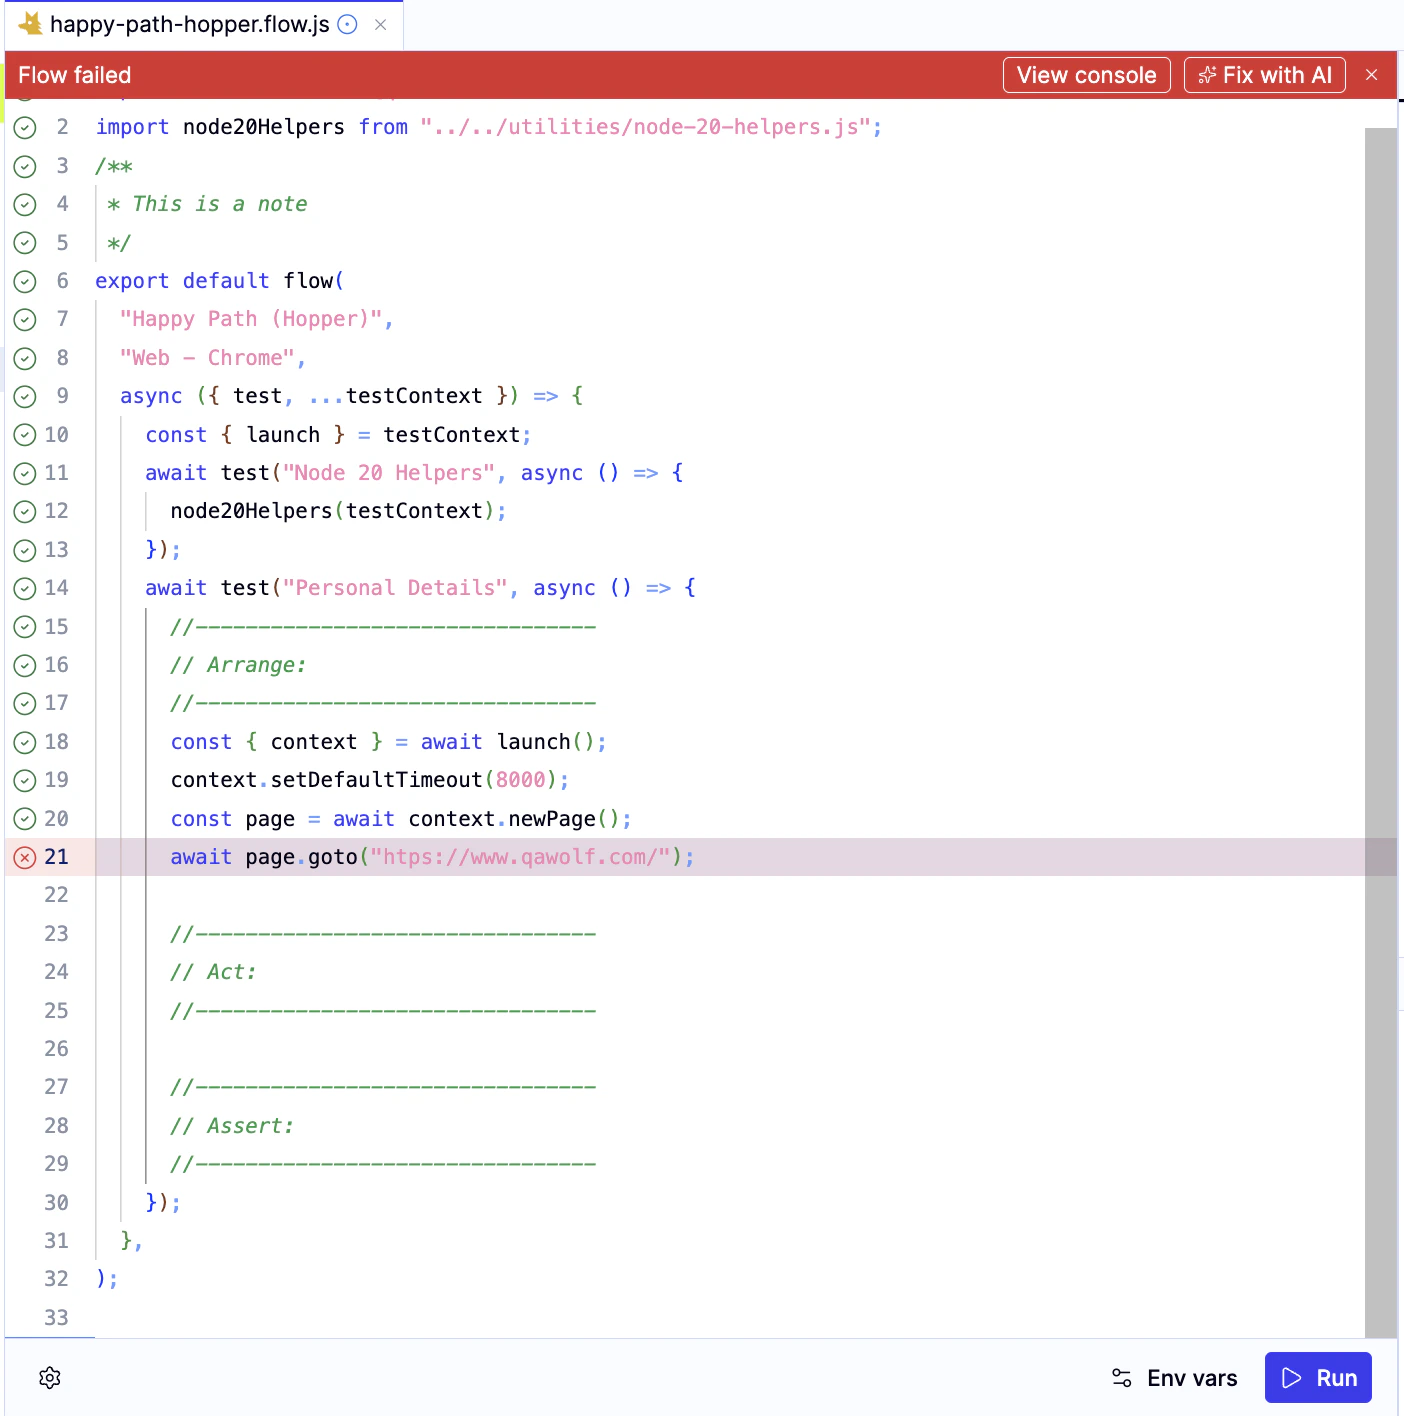 You have two options for fixing it:
**Fix with AI** — click **Fix with AI** in the banner to let Automation AI diagnose and repair the failure automatically. You can also describe the problem in the AI chat panel or paste the error directly from the **Logs** tab.
**Run selected lines** — reset the app state in the browser, select the lines you want to test, and click **Run**. This lets you iterate on a specific section without re-running the entire flow.
## Use the debugging panels
The bottom-right panel has four tabs that provide different views of your flow's execution.
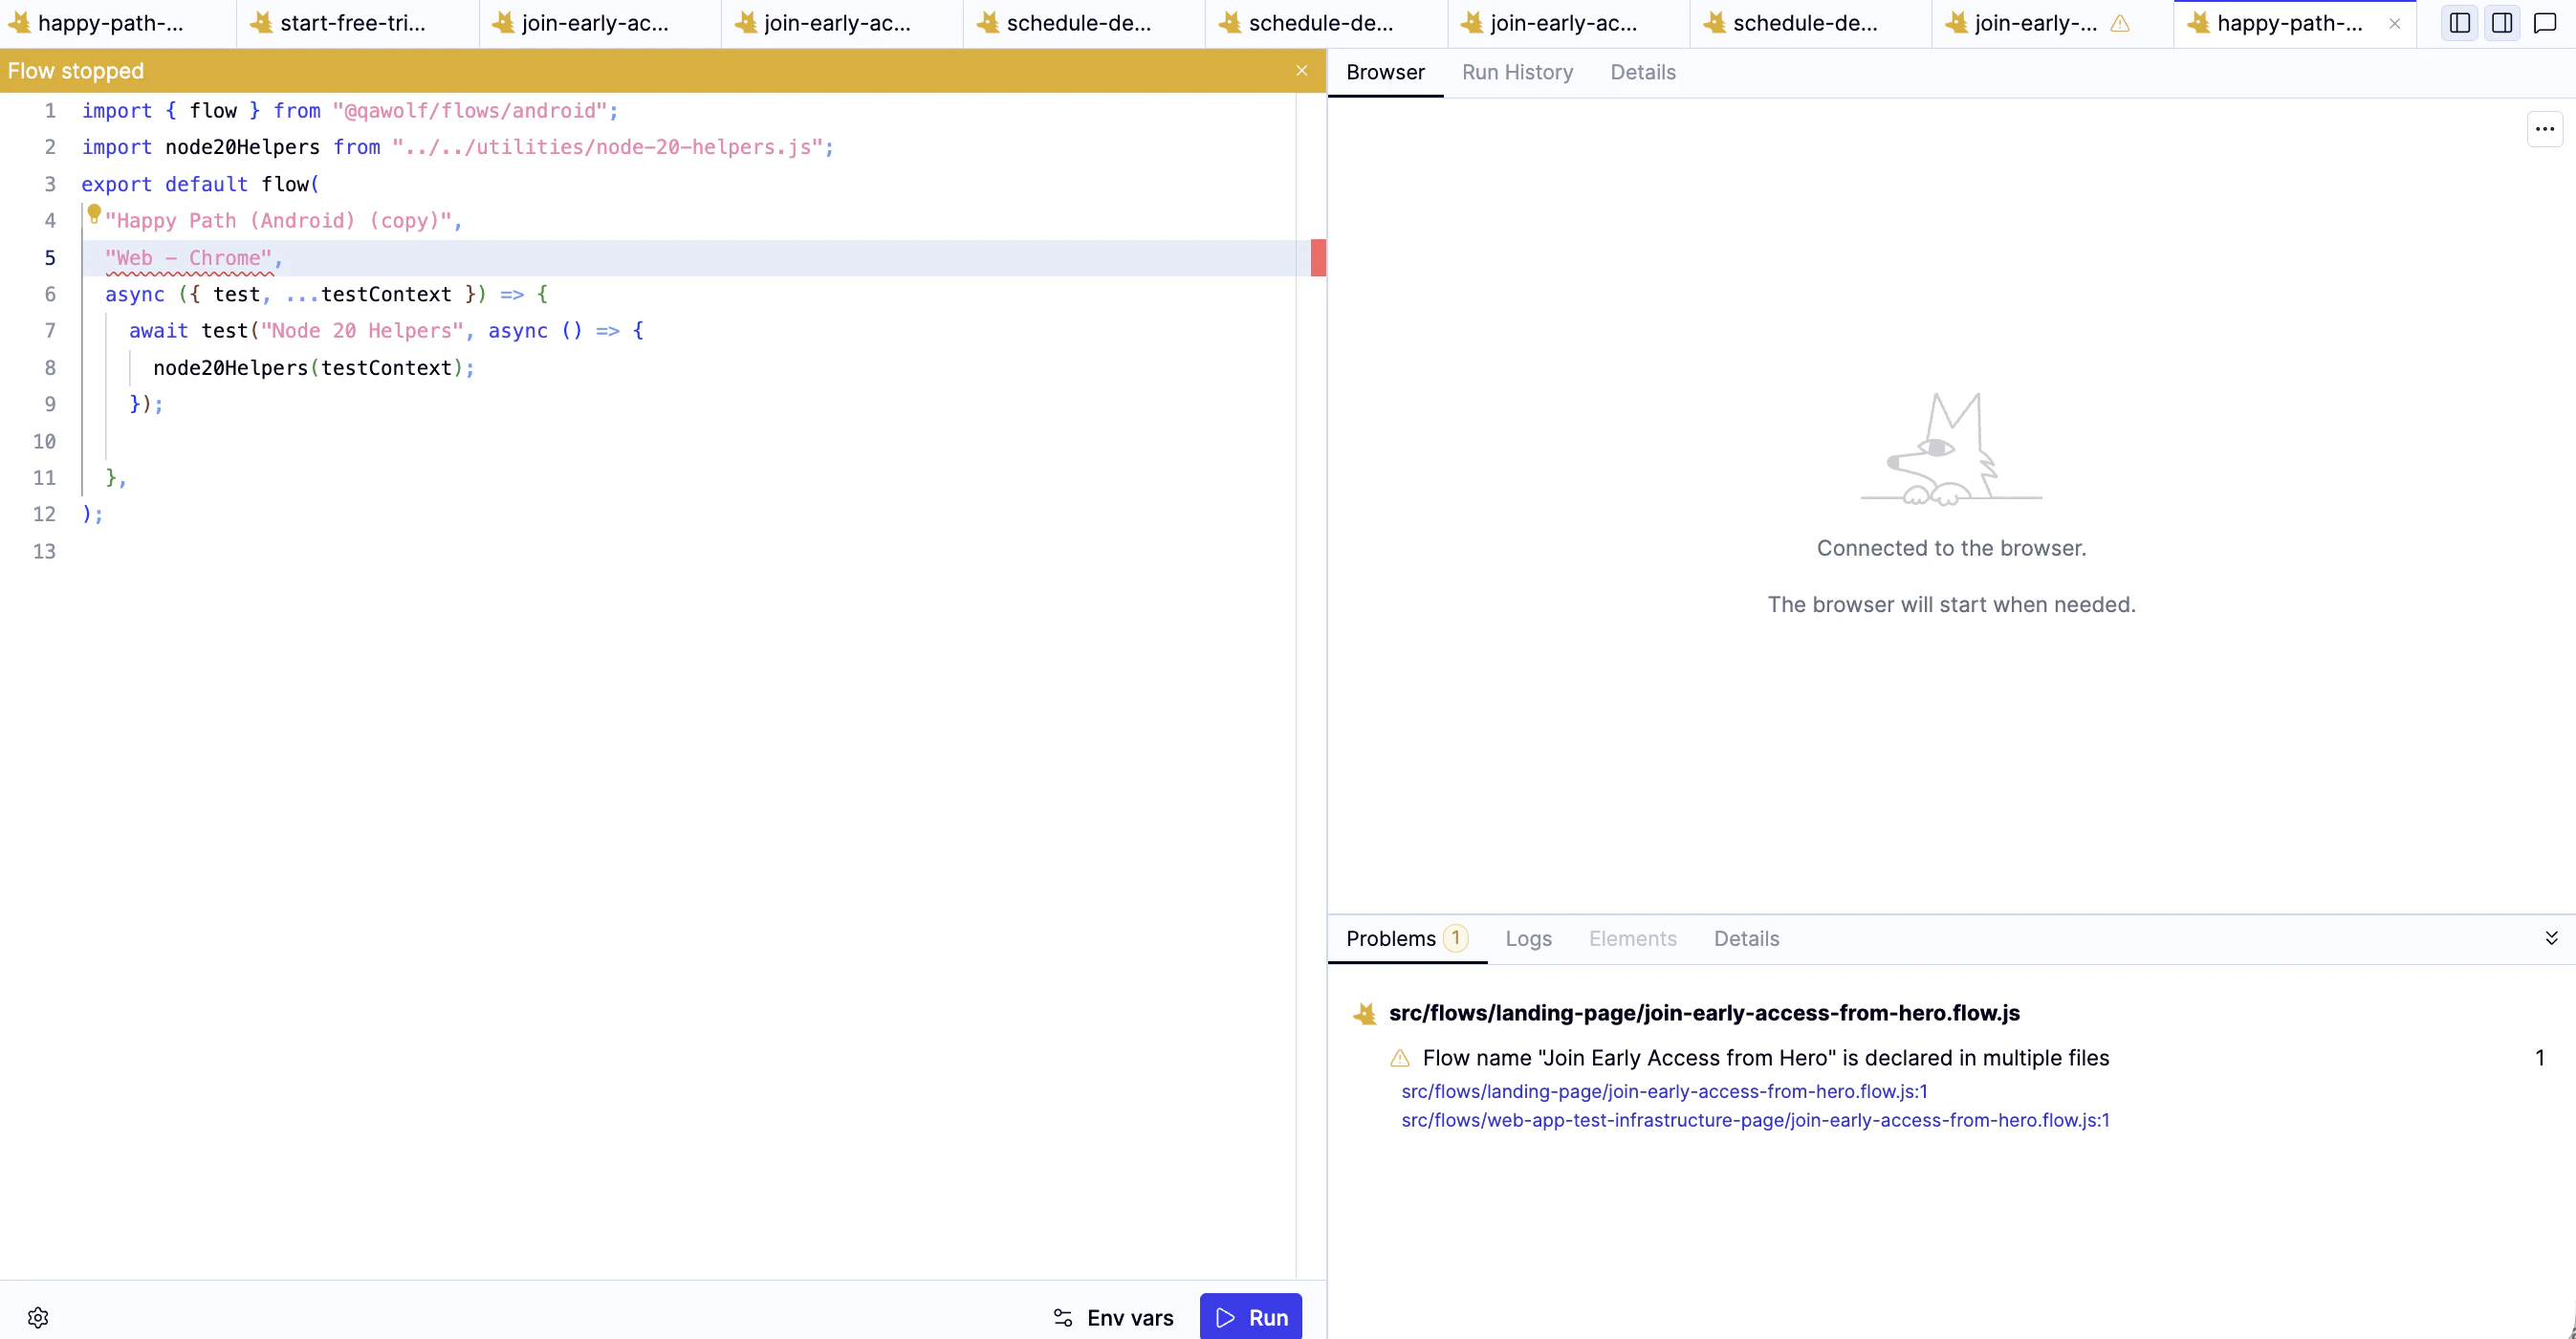
**Problems** — the default tab when you open a flow. Appears when QA Wolf detects issues such as naming conflicts. Affected files and folders are marked with a yellow dot in the file tree. Resolve any problems listed before running or publishing to avoid confusing output.
You have two options for fixing it:
**Fix with AI** — click **Fix with AI** in the banner to let Automation AI diagnose and repair the failure automatically. You can also describe the problem in the AI chat panel or paste the error directly from the **Logs** tab.
**Run selected lines** — reset the app state in the browser, select the lines you want to test, and click **Run**. This lets you iterate on a specific section without re-running the entire flow.
## Use the debugging panels
The bottom-right panel has four tabs that provide different views of your flow's execution.
**Problems** — the default tab when you open a flow. Appears when QA Wolf detects issues such as naming conflicts. Affected files and folders are marked with a yellow dot in the file tree. Resolve any problems listed before running or publishing to avoid confusing output.
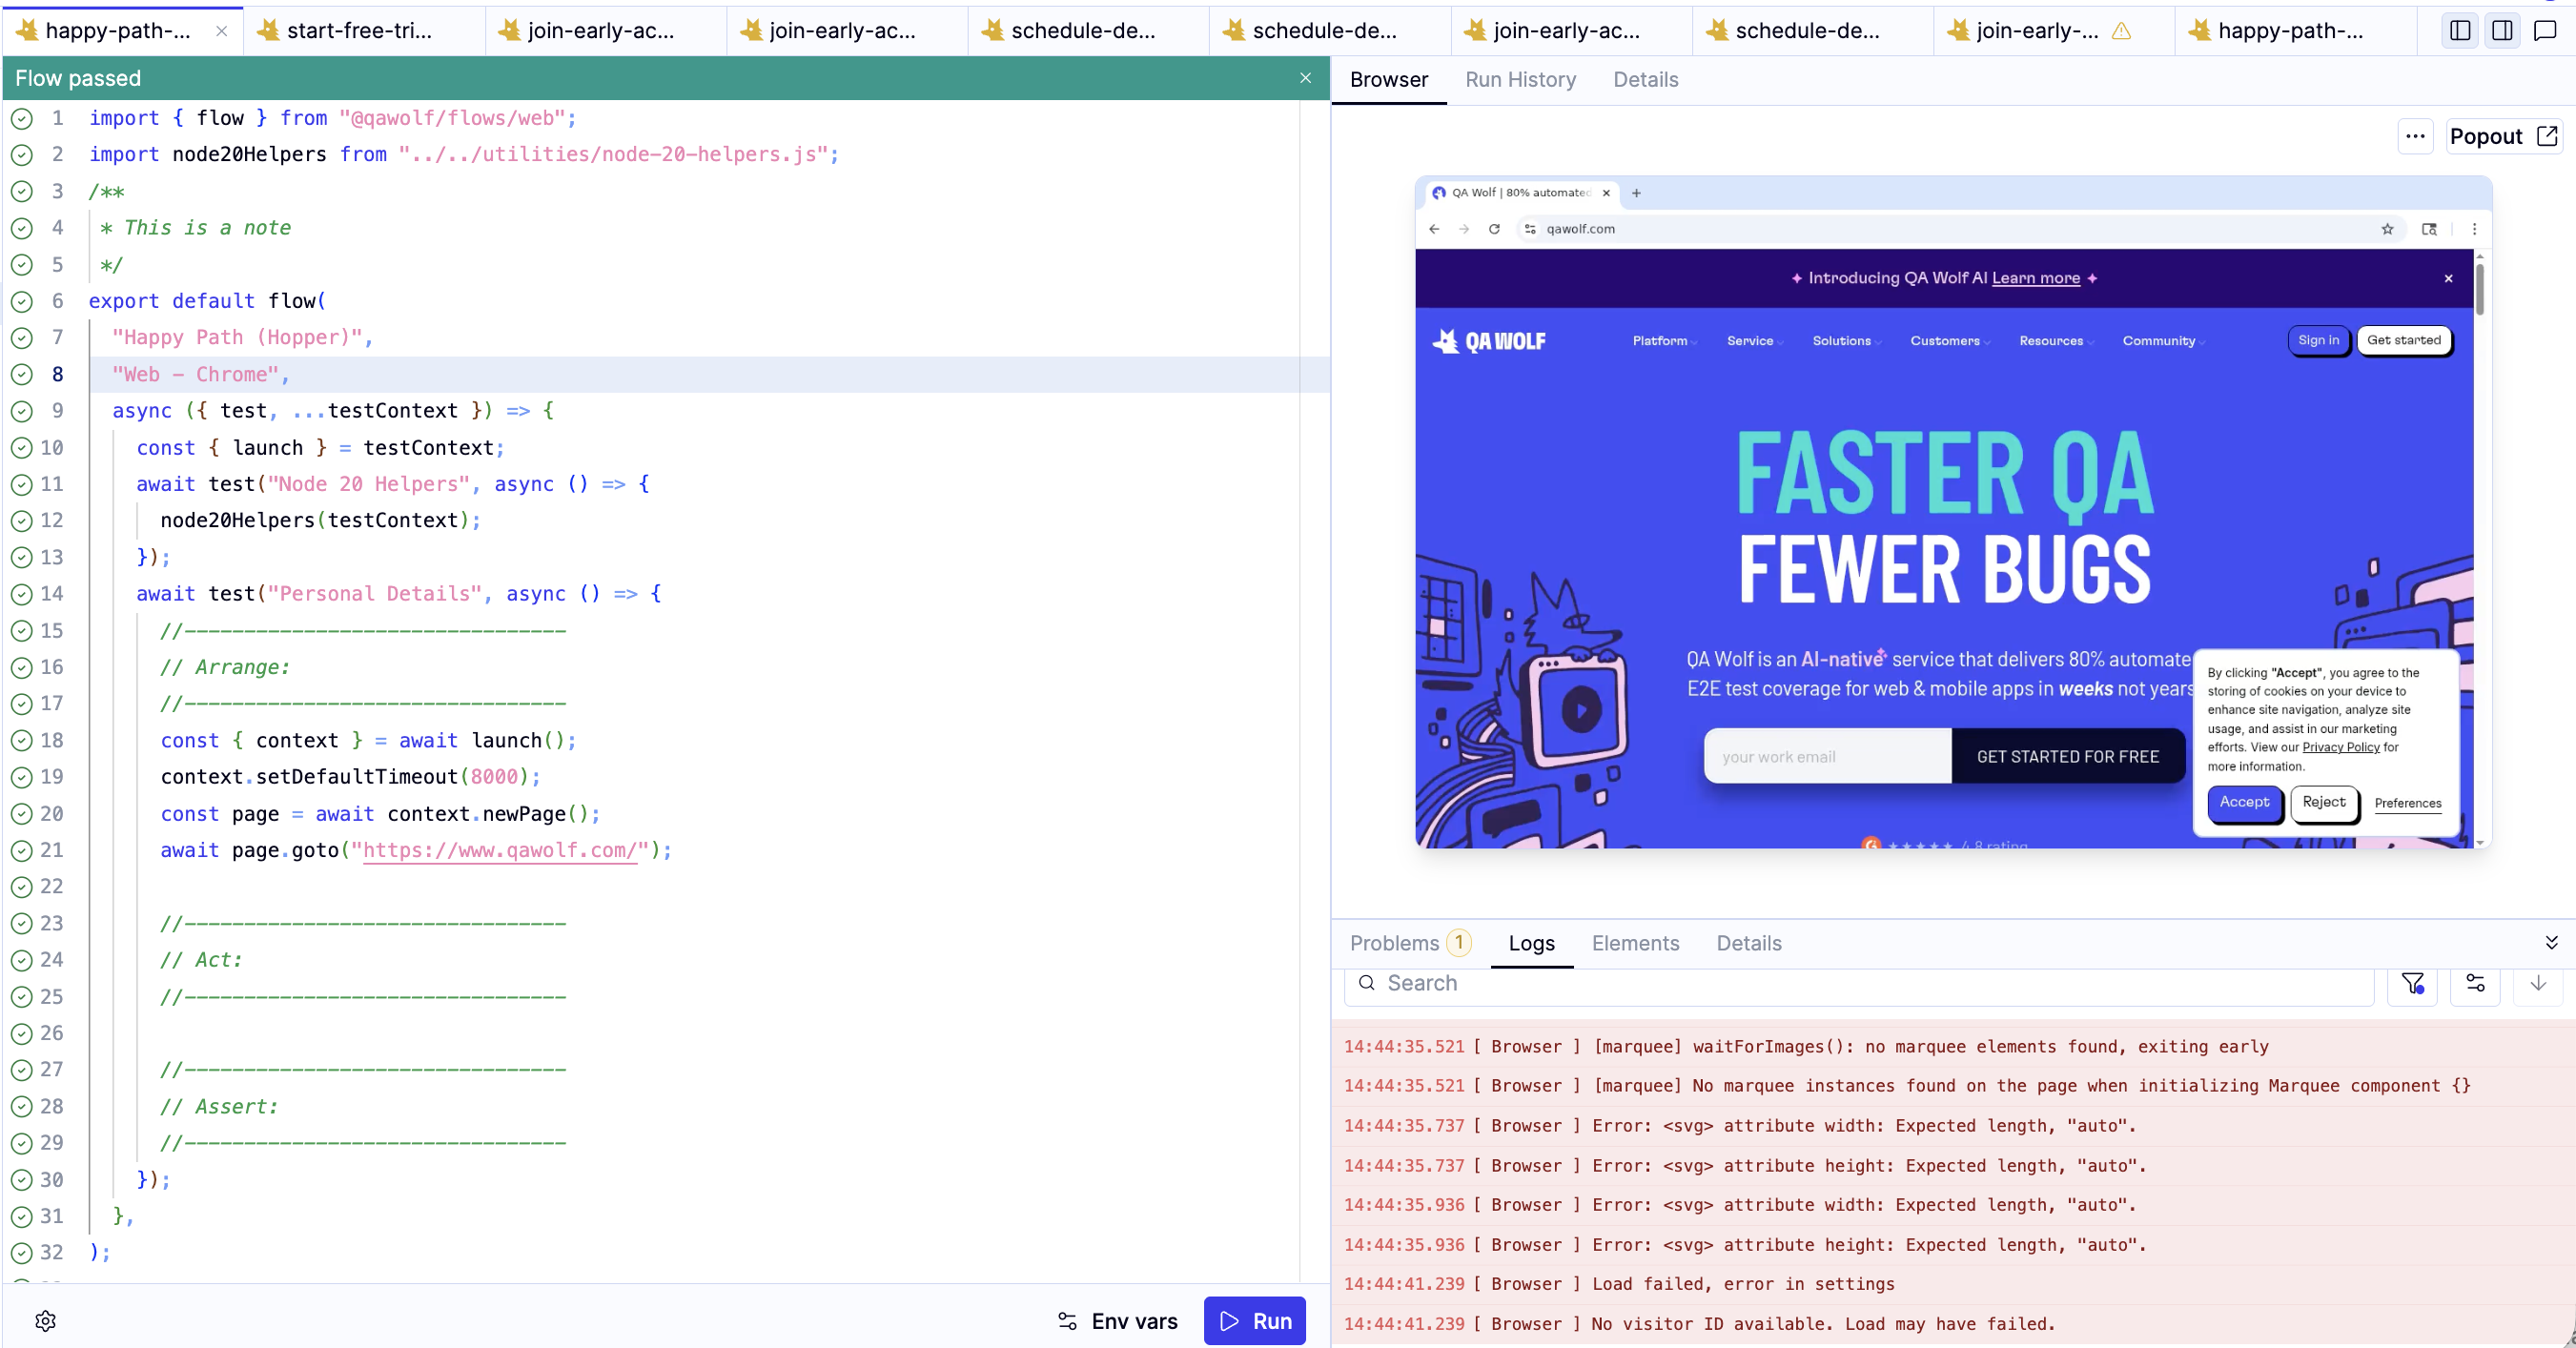
 **Logs** — shows a timestamped execution log. When a flow fails, the error message here is the fastest way to understand what went wrong. You can paste the log output directly into the AI chat panel to get a fix.
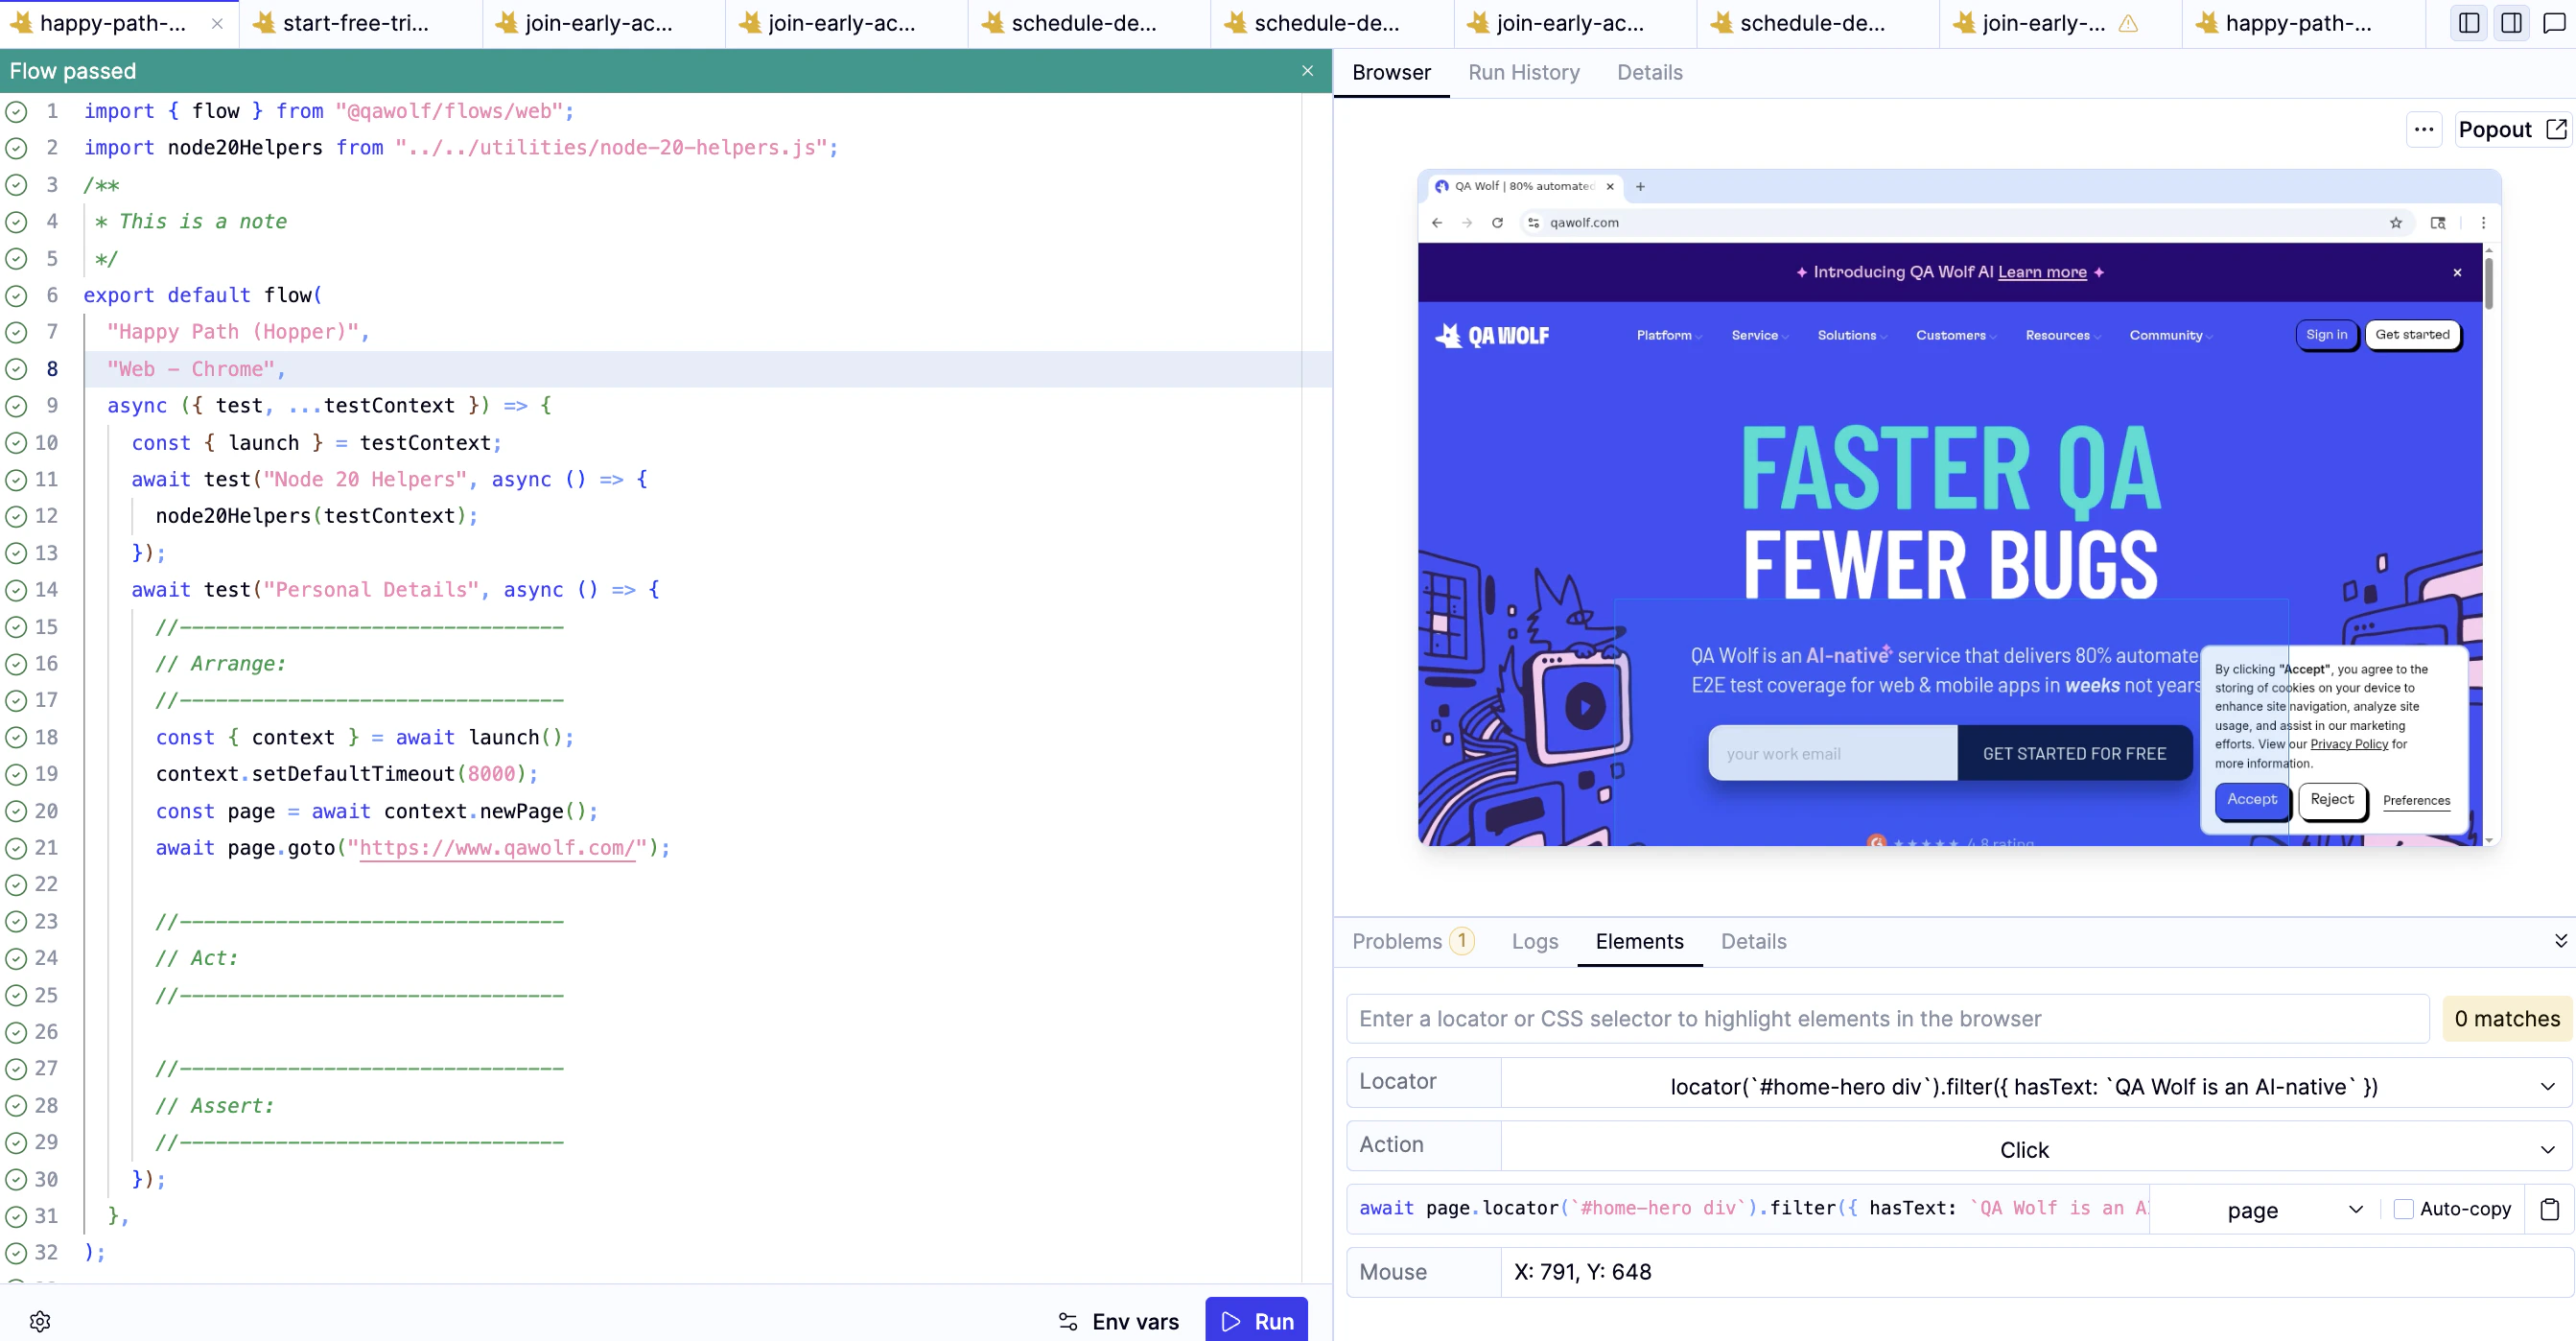
 **Elements** — lets you enter a locator or CSS selector to highlight matching elements in the live browser. Useful for verifying selectors while writing or debugging a flow. See [Element picker](/qawolf/Use-the-Elements-picker-2c35b2a994fb80a681baca4f6acf3179) for more details.
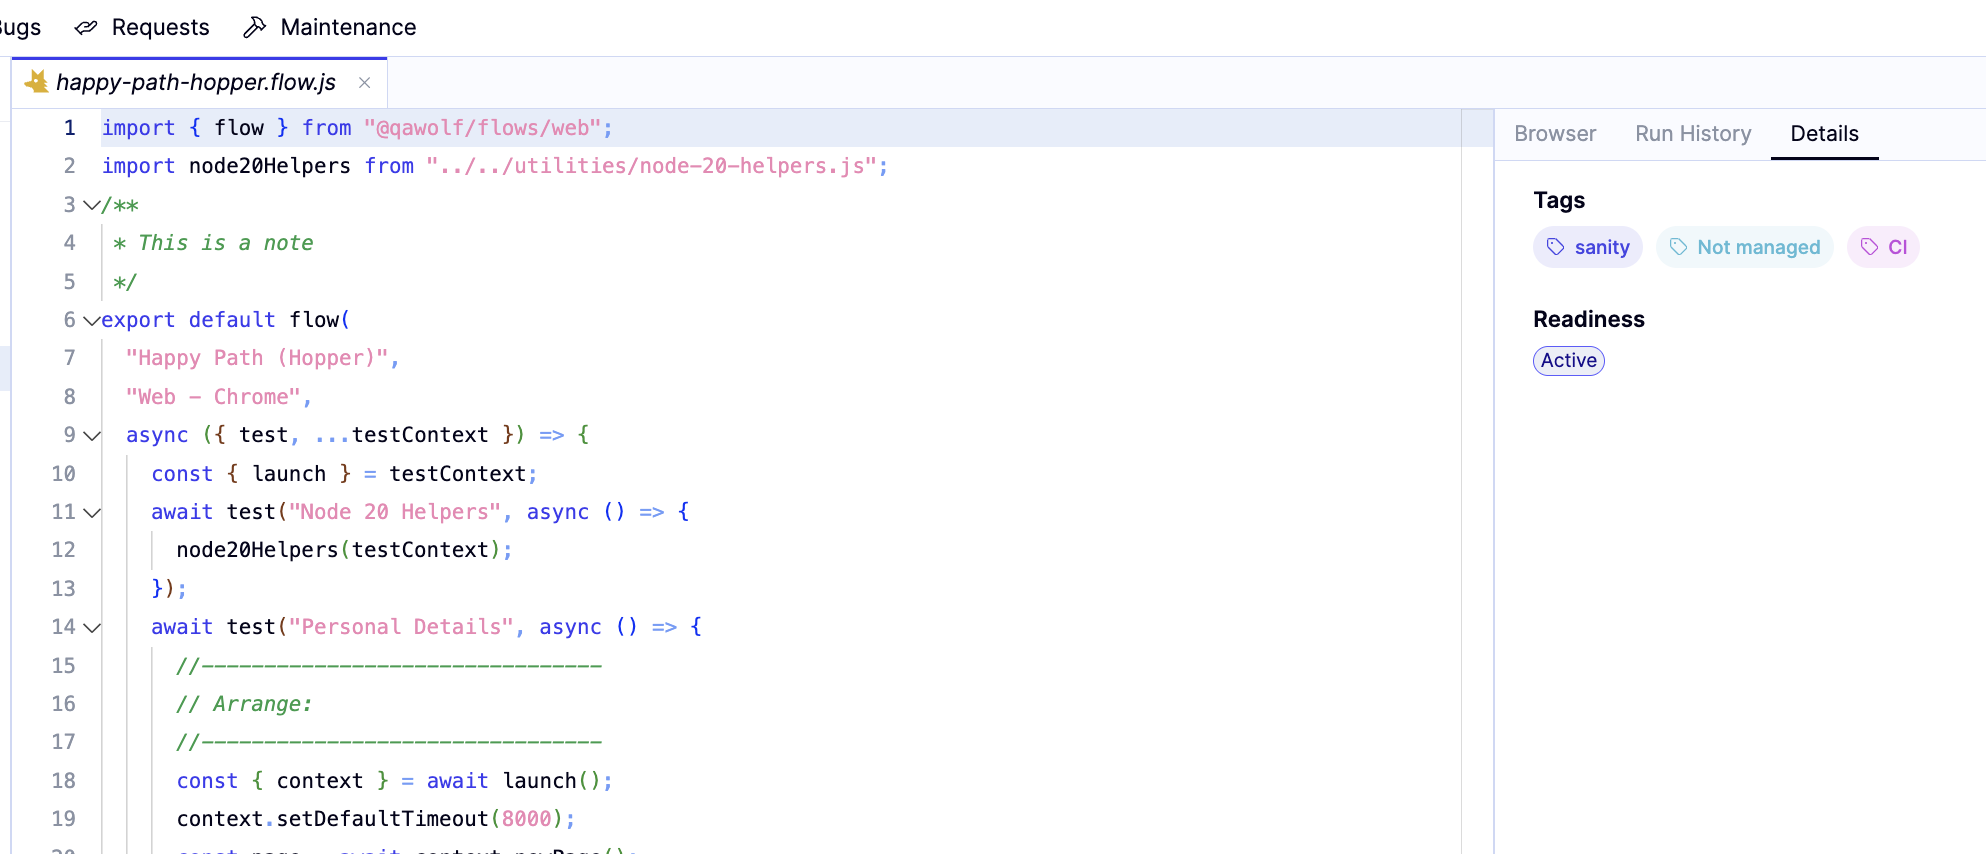
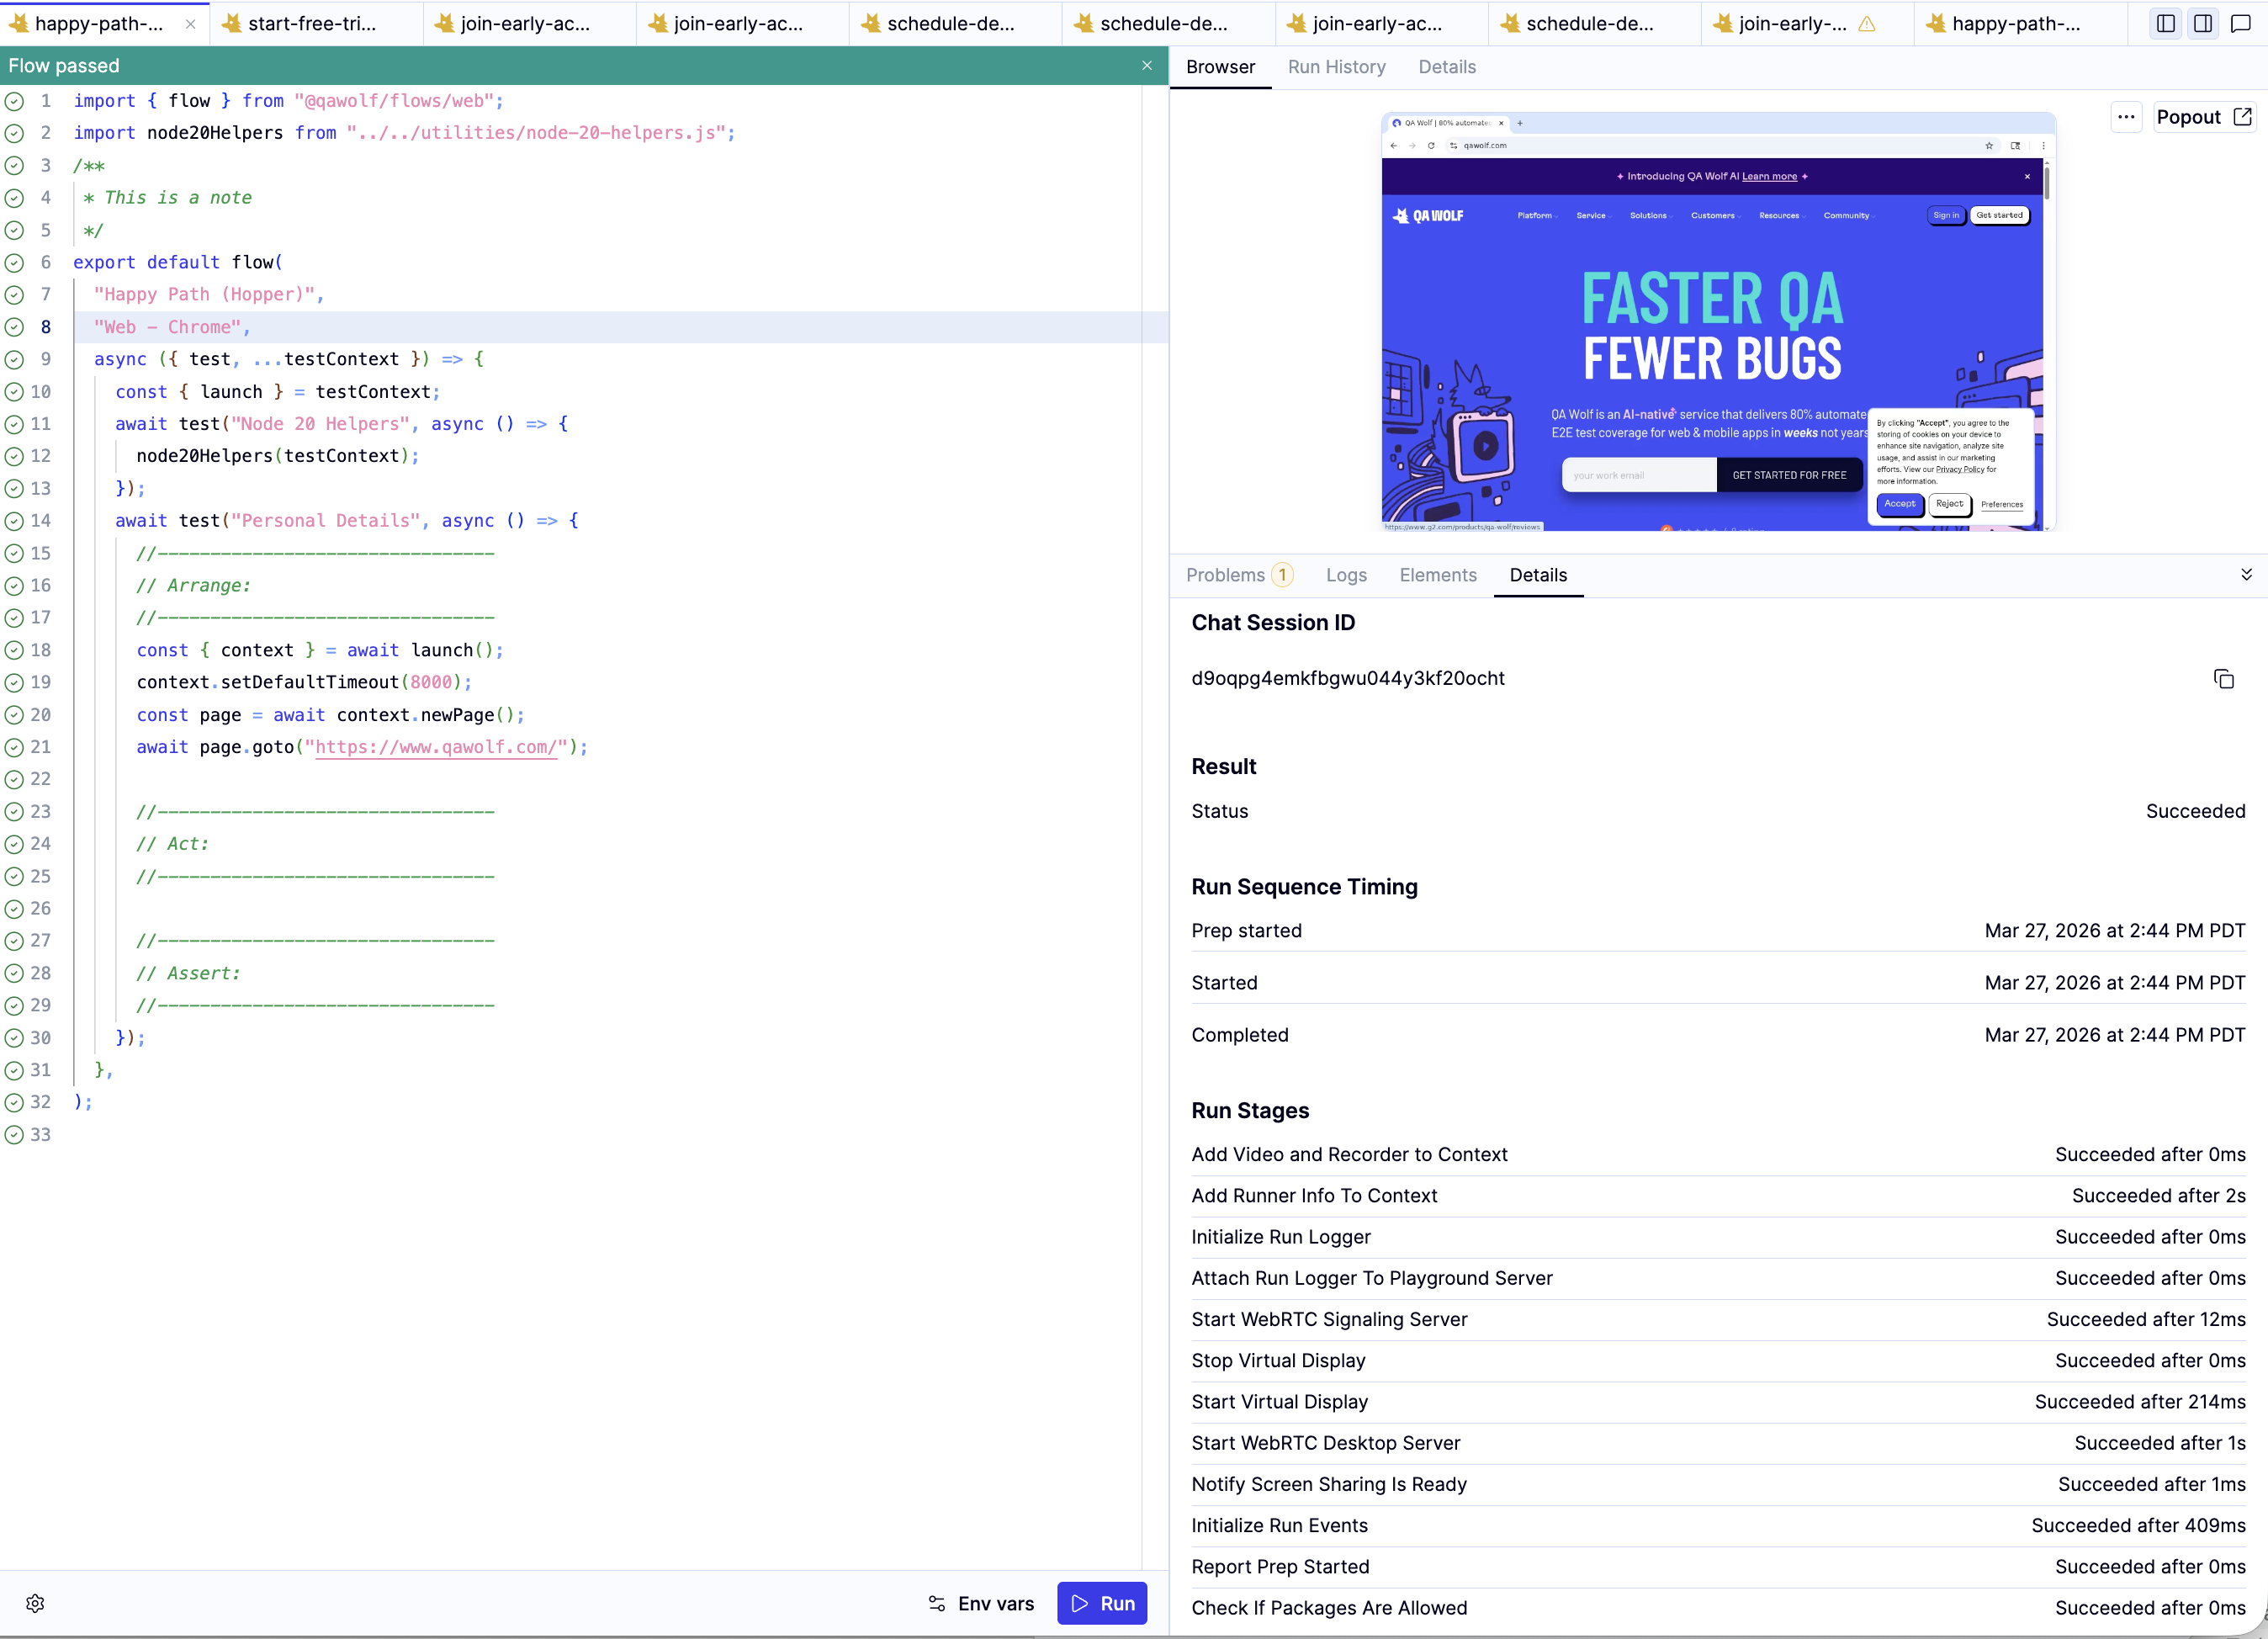
 **Details** — shows tags and readiness status for the current flow. Both fields can be edited directly from this tab. After a run, switches to show individual run steps with timing, useful for identifying slow or hung steps.
 ## Check run history
The **Run History** tab shows a pass/fail chart and the result of the most recent run.
## Check run history
The **Run History** tab shows a pass/fail chart and the result of the most recent run.
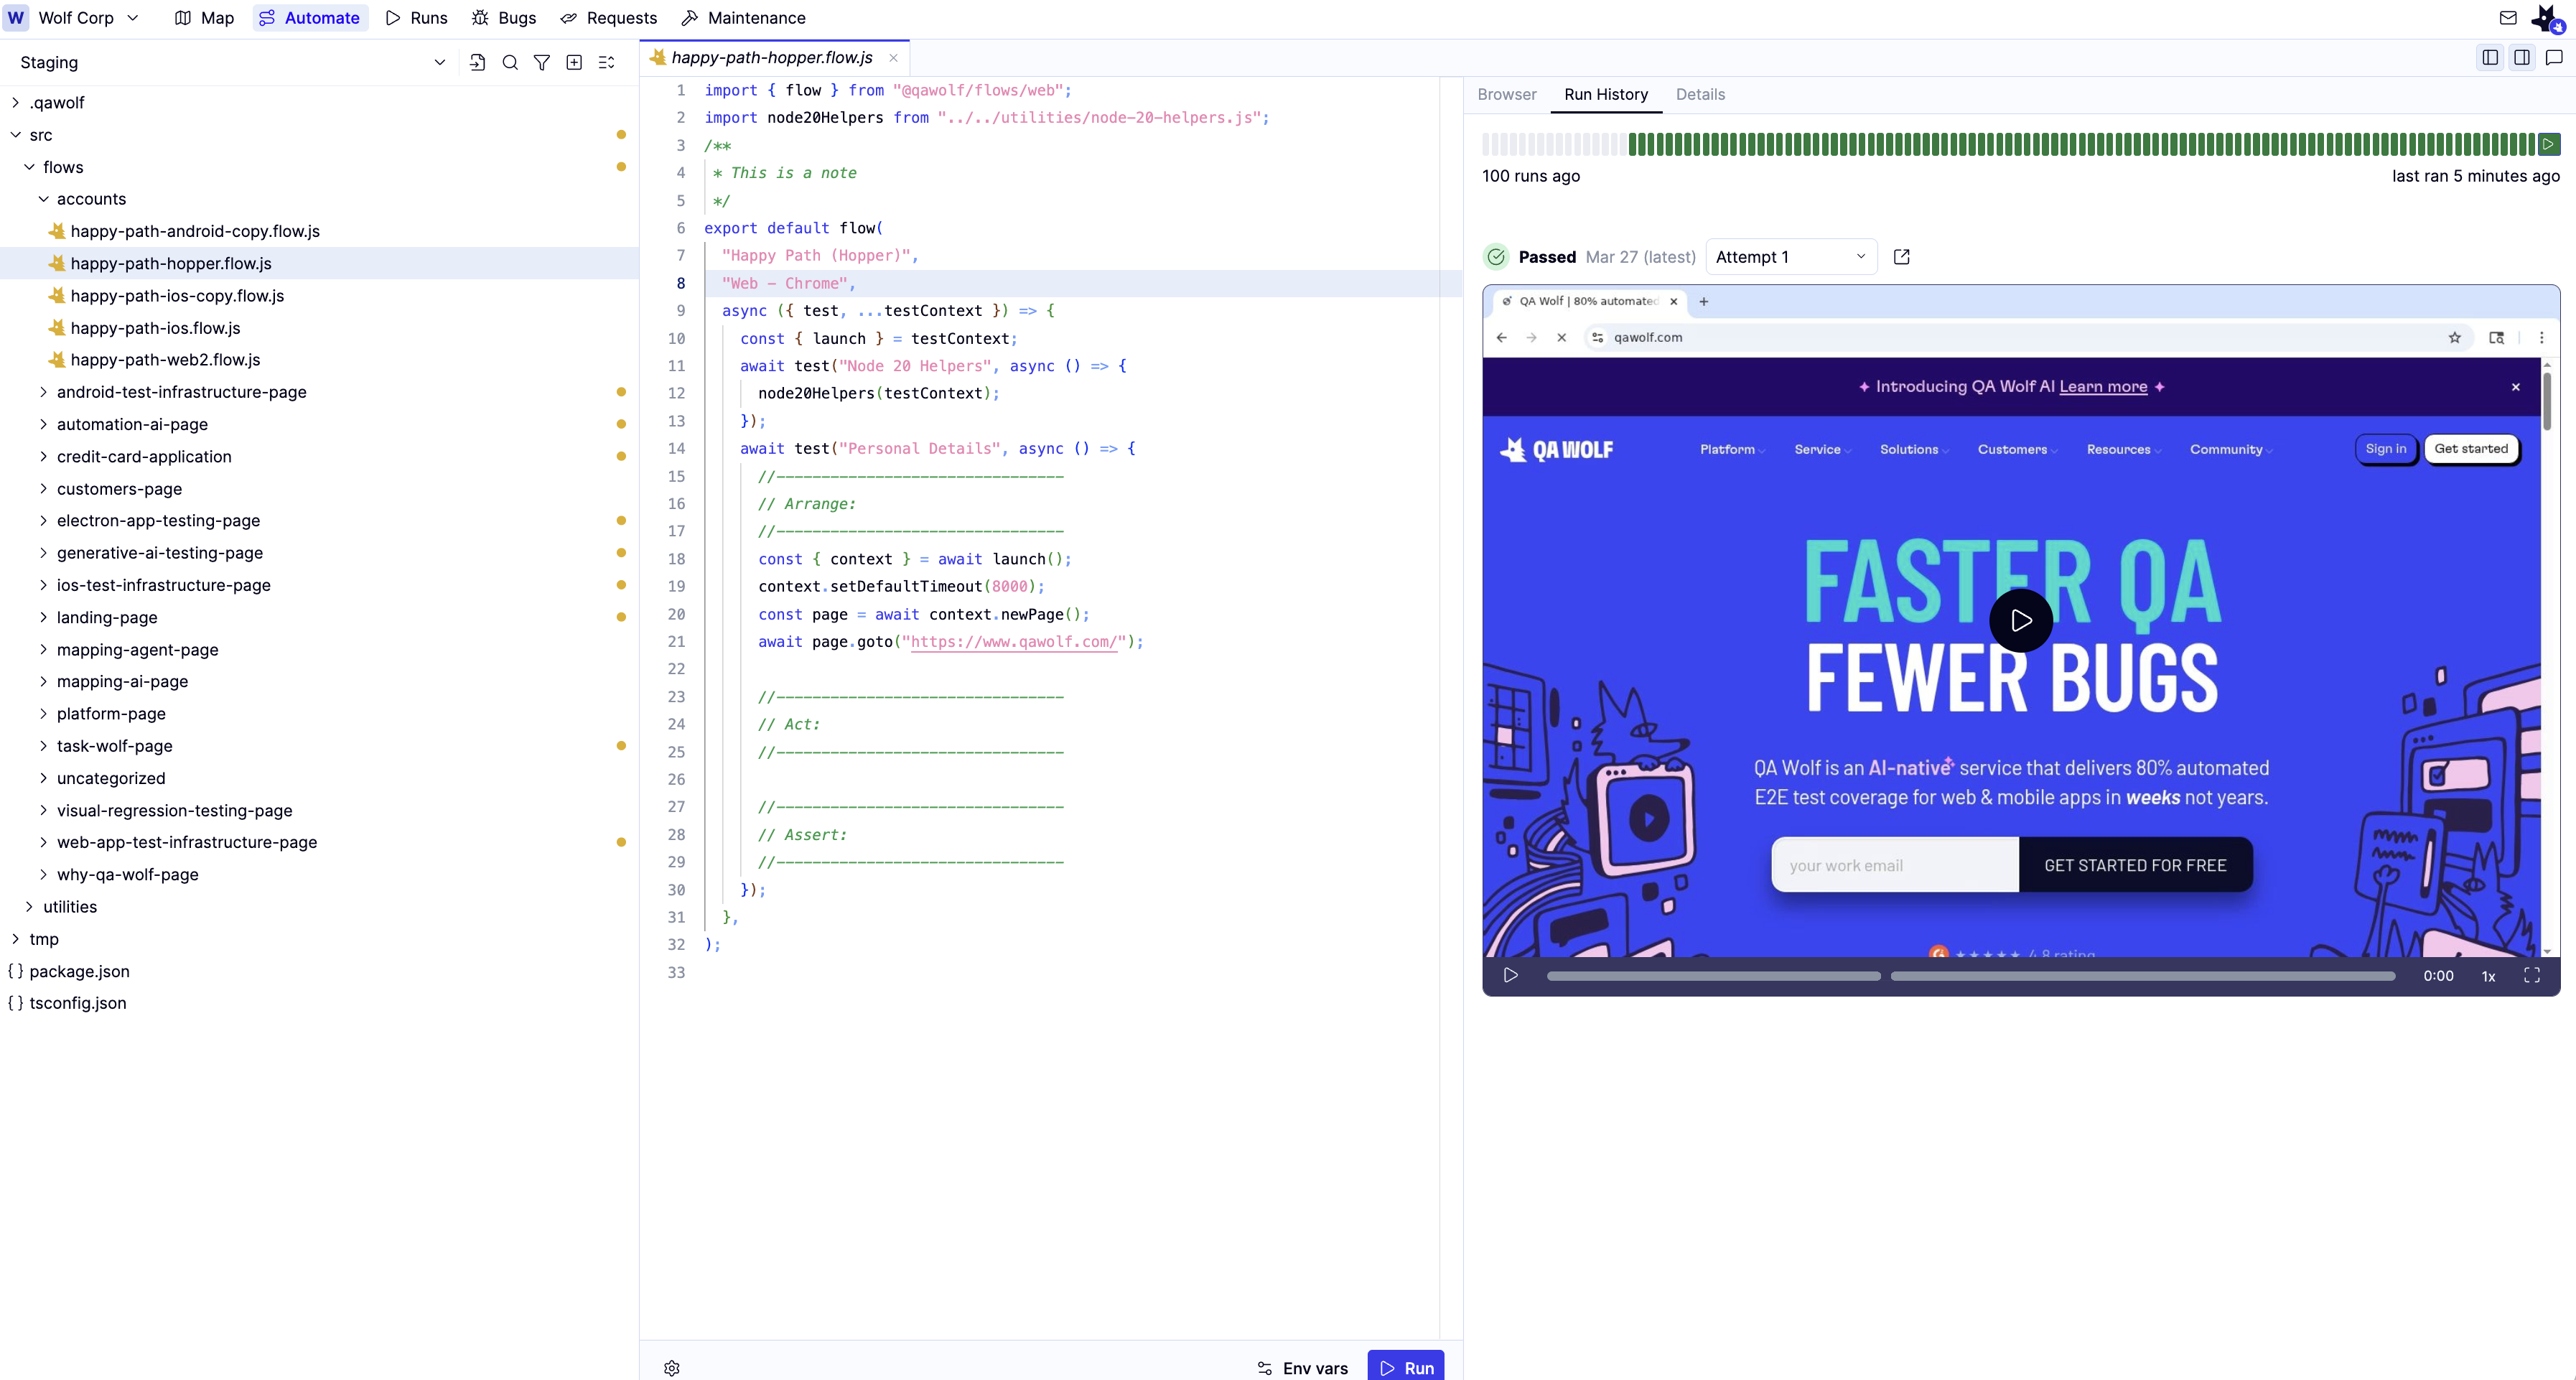 Run History only shows results from scheduled runs. Manual runs from the editor or Map tab do not appear here. See [How Runs work](/qawolf/Run-a-flow-or-suite-2a25b2a994fb8014b164d7ad2efd5ddel) for a full explanation of run types.
## Manage tags and readiness status
The **Details** tab shows the tags and readiness status assigned to the current flow. Both fields can be edited directly from this tab using the icon next to each field.
After a run, the tab switches to display individual run steps with timing, which is useful for identifying slow or hung steps.
Run History only shows results from scheduled runs. Manual runs from the editor or Map tab do not appear here. See [How Runs work](/qawolf/Run-a-flow-or-suite-2a25b2a994fb8014b164d7ad2efd5ddel) for a full explanation of run types.
## Manage tags and readiness status
The **Details** tab shows the tags and readiness status assigned to the current flow. Both fields can be edited directly from this tab using the icon next to each field.
After a run, the tab switches to display individual run steps with timing, which is useful for identifying slow or hung steps.